USING THE PUT/CALL RATIO TO FORECAST 5% CORRECTIONS
It has been awhile since I looked into the put/call ratio to gauge whether sentiment has reached extreme levels. The reason I have turned my back on this indicator for most of the past 12 months is twofold. First, the technical work I was doing with respect to gauging tops and bottoms was working in such a harmonious manner that I didn't feel the need to muddle it up with noise. Second, WHEN you use any device to gauge price matters just as much as the device you are using.
Allow me to amplify the second point by giving you a real life example of WHEN being of consequence. Take the man who decides to go hang out at a bar. If that man goes and takes a shot of tequila at 9 a.m. on a Wednesday, he will be seen as an irresponsible person with drinking problems. If that same man is to go the same bar 12 hours later at 9 p.m., takes his shot and laughs with some friends, he will be seen as a guy who just likes to party. When matters.
Similarly, in the markets, WHEN you use an indicator can be the difference between being a floundering amateur or an upstanding professional. Certain indicators will work brilliantly under the right set of circumstances. They will also fail miserably under circumstances that aren't well suited to using that particular indicator. Just like a bad relationship, the key is knowing when to walk away.
The put/call ratio may be at a point now that it can be useful again in the presence of numerous sentiment indicators that have been failing since January. There has been a consistent tendency to judge market participants as being excessively bullish, whether due to sentiment surveys, levels of margin debt or the run of the mill anecdotal evidence that pops up every few weeks.
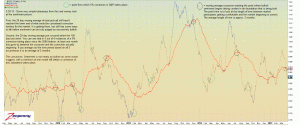
With the put/call ratio I like to use moving averages only. I also like to look at things like the length of time between the moving averages crossing over. The reason being that a short-term moving average crossing below a long-term moving average is a sign of a persistent shift in sentiment as opposed to anything temporary. The longer that shift remains in place, the more comfortable market participants are becoming with the foundation of the prevailing psychology.
In the chart below you will see that the 20 day moving average of the total put/call ratio recently cross below the 100 day moving average. I go over what it means, along with what the absolute levels of sentiment according to the moving averages are telling us here and now:
click chart to enlarge


