
WHY AAPL JUST HAD ITS MOST SIGNIFICANT WEEK SINCE APRIL 2012
First, a history of the price target that was just hit on the dot for AAPL:
- On January 23rd this chart was posted showing the next logical area for support as being the generational trajectory from the 1987 high for AAPL. The price target this trajectory pointed to was 400-420.
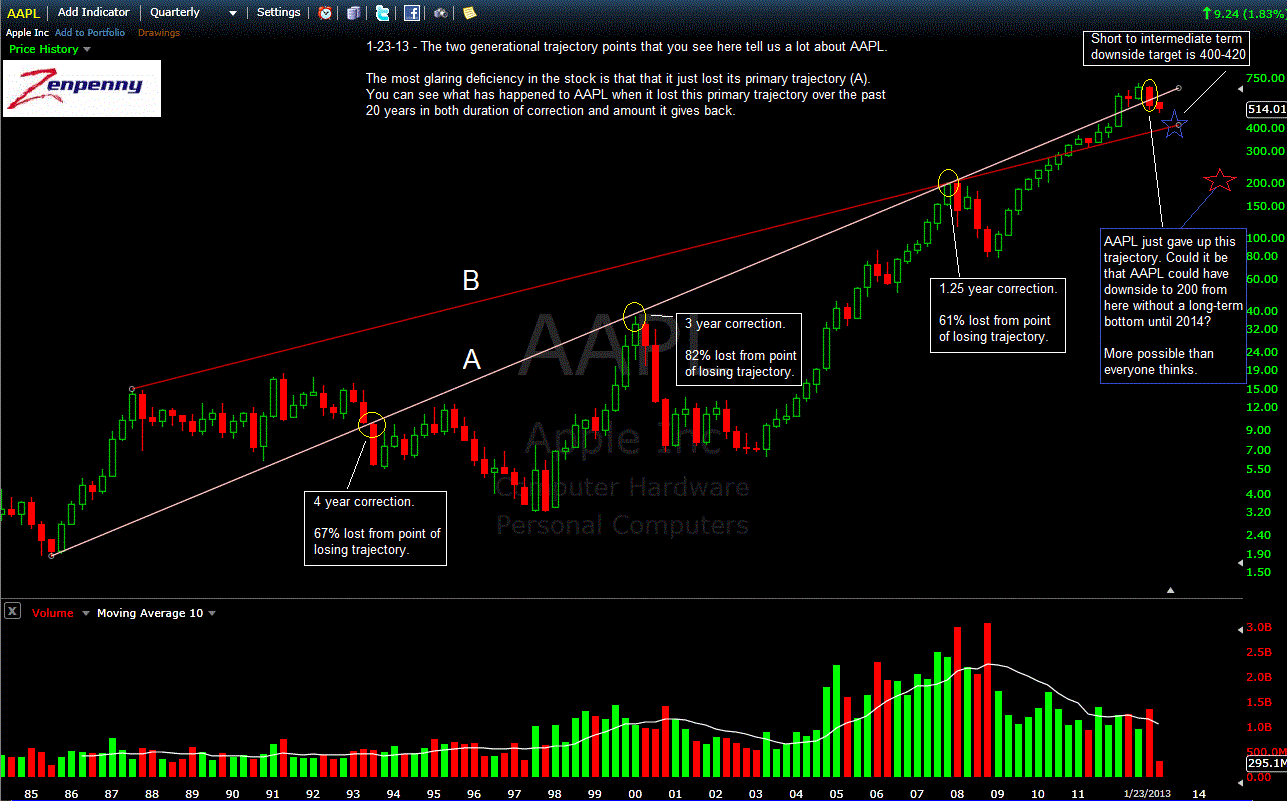
- As AAPL got closer to the trajectory through a routine of steadily dripping lower, on March 4th this chart was posted bringing greater clarity to the ultimate downside target revealing 390 as being the destination for any sustained attempt at a bounce.
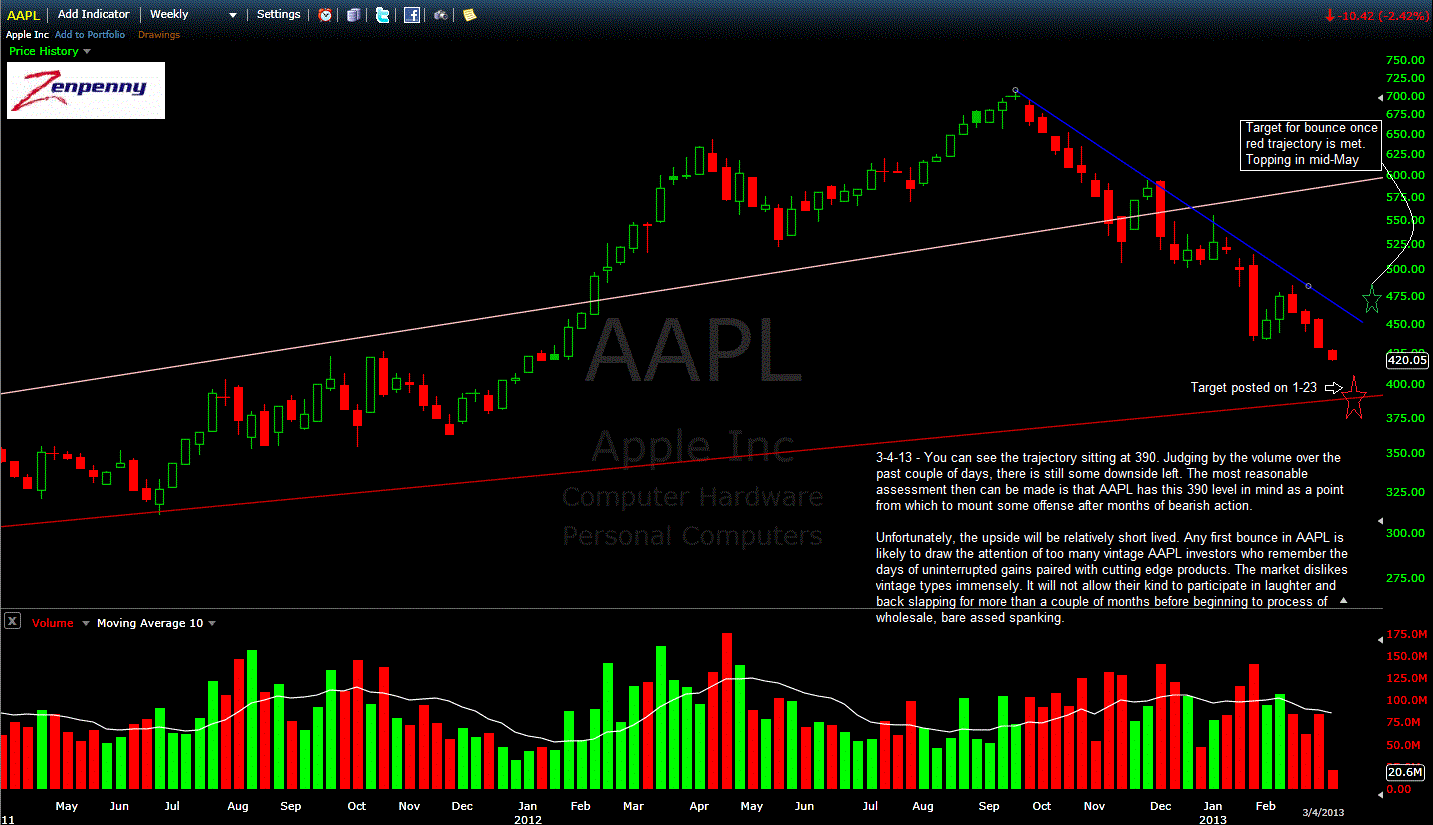
The low on April 19th was 385.10.
Last weekend I posted an article titled, "AAPL: Downside Price Target Achieved, Now What?" In the article I discussed one of the expected results of hitting an extremely important level of support is high volume. While we didn't get that volume surge last week, this week we certainly did. In fact, it was the biggest weekly volume surge in AAPL shares since April of 2012. This is important not simply because volume finally decided to show up in AAPL, but WHERE that volume showed up gives away a ton of information.
Here is a detailed look at AAPL on a weekly basis:

AAPL WEEKLY