IS THE SOX FORETELLING A MAJOR CORRECTION IN THE MONTHS AHEAD?
If you came up in the old school, you realize the value of the SOX (Semiconductor Index) as a predictive indicator for technology and thus the entire market. While the SOX is not nearly as relevant in the grand scheme of technology as it was a decade ago, its predictive powers should be no means be discounted by those among us who did not witness the days when hardware ruled technology investing.
While it has grown increasingly repugnant to have a bearish slant on anything but Treasuries and precious metals in 2013, there are certain pieces of information that I feel compelled to pass on, if for nothing else but to open the eyes of investors to possibilities that are not currently being entertained. It is after all during the most "feel good" periods that the markets decide to unveil a can of whoop ass on investors, leaving those who are unprepared scurrying for the comfort of their mother's bosom.
There is certainly an excess of "feel good" here and now. It is noticeable. Much more so than at any point over the past few years, I would venture to say. The action and attention that is being paid to companies like NFLX, TSLA, AMZN and FB is reaching fever levels. Furthermore, investors in the handful of popular names that are favored in the current market have piled on top of each other to the point that when a pullback does come, whether beginning this Friday or 20 Fridays from now, the downside volatility will be extraordinary.
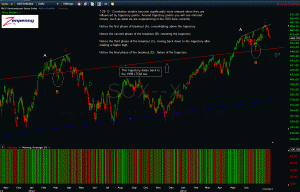
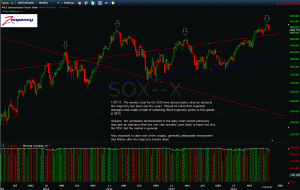
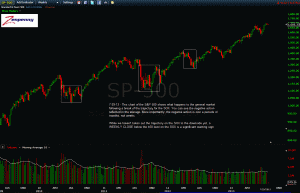
With that said, I would like to point out one valuable piece of potentially bearish information that caught my eye today. The action in the SOX is not only severely lagging the rest of technology, it is correlating perfectly with a previous incident in 2012 that just so happened to take place above the exact same trajectory. To make things even more compelling, let me add that each and every time the SOX has broken this trajectory to the upside and failed since 2010, it has led to a repugnant period for the markets in general.
The charts below will illustrate my point, beginning with a daily chart of the SOX, followed by a weekly SOX chart and ending with a weekly chart of the S&P 500 to show how the general market reacts:
click chart to enlarge


