AN UPDATE ON THE DIRTY SOX
There is a certain value that comes from being old school. It is your choosing whether you utilize that wisdom to be that crooked old man who has memorized every episode of Bonanza or if you use it for more noble causes, such as practicing prudent and patient methods in speculation.
I'm from the old school. I believe in the power of pagers. I like reruns of ALF. I often wonder what happened to guys like Special ED and Kwame. Rewinding VHS tapes before you took them back was a lesson in courtesy and sometimes, patience. Ricky Shroder is still cool. And Kirk Cameron is kinda creepy now.
Along those lines, there are certain old school market indicators that are worth their weight in gold. One of those is the SOX. I went over the SOX in detail on July 29th, in a post titled: Is The SOX Foretelling A Major Correction In The Months Ahead?
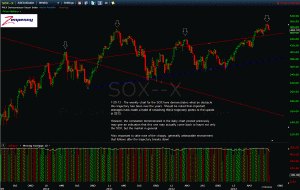
Now is a good time to bring up the SOX because it is on the verge of violating a technical point that is as important as any. Since 2010, a break below this point has occurred three separate times. In each case, the market went into a multi-month sloppy, corrective phase that was best avoided. Three times does not a statistic make...I know. However, given the other negative technical events that are taking place, this certainly bears watching.
The first chart shows the failure of the technical point and what is has led to in the past. This the same chart posted in the July 29th posting:
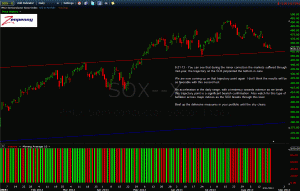
The next chart shows the SOX at present. We are awfully close here. Important see how we end the week:


