
What follows is a section from the “Thoughts & Analysis” portion of my monthly letter to investors at T11 Capital.
Stock Market Post-Traumatic Stress Disorder
If you are to believe the flock of market pundits currently making the rounds then you would have no other choice but to believe that a new world order is in place. This new world order does not rely on any common sense measures of economic progress or stability but rather dwells in sorrow of past crisis situations in order to arrive at current conclusions.
If you have been reading my monthly letters with some frequency then you will recall the dozen or so times I have stated that the the years between 2000-2009, marked by the dual “once in a lifetime” crisis situations of the internet bubble bursting and the mortgage debt bubble following relatively closely behind, has caused post-traumatic stress disorder to become apparent among the current generation of investors.
This post-traumatic stress disorder is marked by a near obsession with calamity resembling calamities of the past decade. We have not had a pullback, macro induced or otherwise, that hasn't been a precursor to either a recession, secondary debt crisis or complete global economic collapse since the 2009 bottom. And of course the word “bubble” has now become ingrained in financial vocabulary as a means of describing anything that moves up in a straight line for a period exceeding 12 months.
The point being that a majority of the analysis being pressed upon the impressionable minds of a naive and uniformed investor base, institutional or otherwise, is being formed using past traumatic experiences that incorrectly shape future expectations. This current form of thinking is not isolated by any stretch but rather an epidemic.
If you are to believe this line of thinking with respect to prevailing market psychology to be true then two things become immediately apparent:
- Pullbacks will appear calamitous in nature as the feedback loop of past trauma induced psychology meets with current perceived negative developments in the markets. This will express itself through momentum on the downside.
- Pullbacks will bottom suddenly, with a majority of them being shallow in nature, as a result of a convergence of selling taking place around the same areas due to near identical mental output of a majority of participants.
What we have experienced over the past few months has resulted in a pullback of some 15% from peak to trough for the S&P 500. This has been excessive for the current bull market as measured by pullbacks experienced since the 2009 bottom. The reason for the dramatic price action to the downside is that the stress laden mindset of the current investor base has for the first time, since the 2011 Euro crisis, tangible evidence for its existence. That evidence comes in the form of fears from abroad, mainly Chinese economic issues spilling over into a global economic recession. And, of course, fears of collapsing oil prices and the resulting debt defaults by U.S. energy companies. Just for good measure, throw in a slowdown in corporate earnings, as well.
My own theory with respect to a market environment dominated by individuals with a form of financial post-traumatic stress disorder is that it creates an extraordinary support mechanism for assets that can only be broken through severe, systemic financial stress. The reason for this support mechanism is that investors uniformly will congregate around the same areas for the same reasons for their liquidation of assets. Again, this results in quick, shallow pullbacks that appear calamitous but are quickly exhausted.
A prime example is the rally from the 2009 lows that has been consistently sighted as one of the most persistent, steady uptrends in market history. It is no coincidence at all that such an uptrend develops following severe psychological stress among market participants. That stress is what creates tepid responses to even a 3% pullback from the highs causing a confluence of bearish activity to take place in the same spots.
Extended, deep pullbacks only occur when a significant segment of the investment population doesn't believe in the voracity of the decline. This sets the markets up for a stair step process lower as different levels of conviction are defeated over time.
When there is no conviction in a market due to past stress then there is no stair step process, only a sudden rush lower that is met by buyers eventually. This is a counter-intuitive phenomenon that is important to understand.
Now that we know a support mechanism exists for the markets, let's look at whether there is severe, systemic financial stress that can overwhelm the support mechanism.
The Facts
During the debt crisis of 2008-2009 we had systemic risk that was for the first time ubiquitous across all balance sheets. In other words, consumer, corporate, international and domestic balance sheets were all drinking from the same cup filled with a tasty cyanide laced beverage in the form of debt tied to real estate assets.
During the internet bubble of 1999-2000 we had another form of systemic risk this time in that both Main Street and Wall Street had concentrated assets in the same group of high-growth investments that later turned out to be the equivalent of a traveling Mexican circus.
What both of these major crisis events have in common is that balance sheets, both consumer and corporate, converge along the same lines creating systemic vulnerabilities in case of the inevitable shifting of the economic landscape.
The question to ask given current economic developments is do we have a convergence of assets, both consumer and corporate, that create sudden, systemic vulnerabilities in case of changes in capital flows?
Here is one piece of evidence from the consumer side of things that speaks volumes:
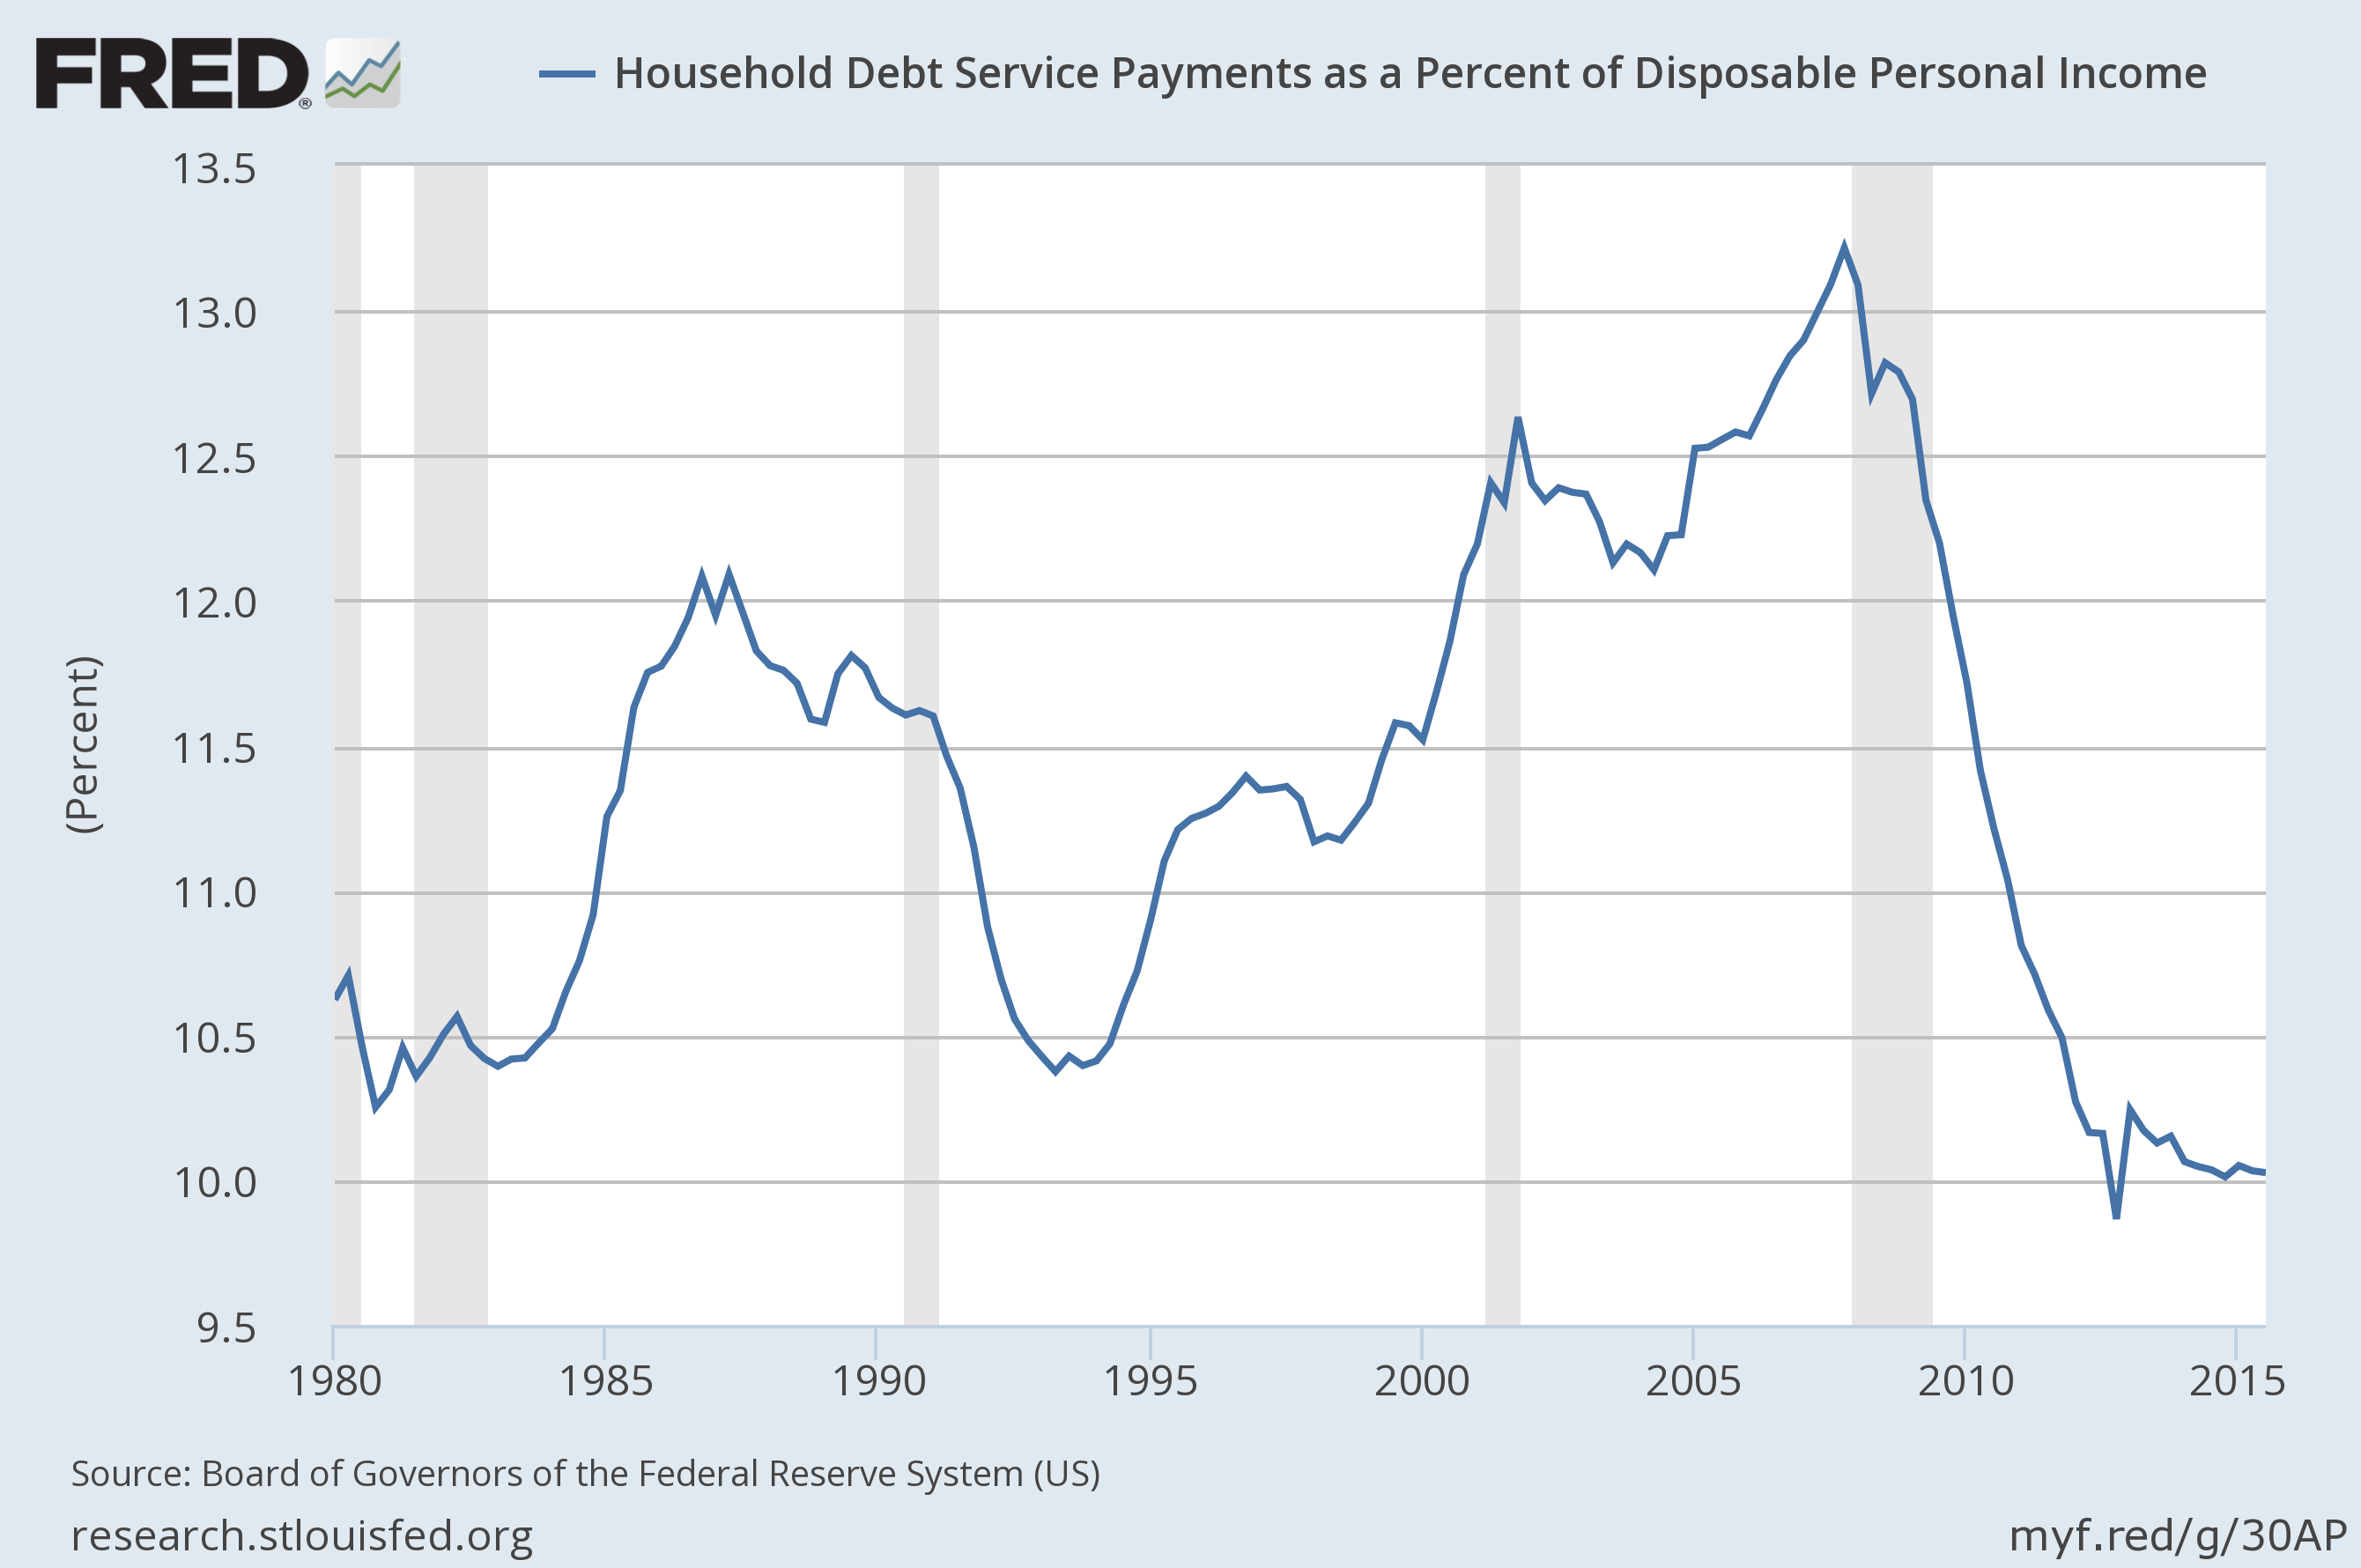
The above chart speaks to the conservative nature of the current consumer household. There is no reliance on any one asset class, whether stock or real estate, to perform in order to maintain a certain lifestyle, as was the case in 2000 and 2008. This very simply means that the average household can withstand a significant amount of volatility in the economy without affecting spending habits.
The one threat to the above data would be an increasing jobless rate. It is difficult to rely on traditional job statistics as unemployment lags the economy badly. However, job openings are a somewhat more reliable indicator of the job market.
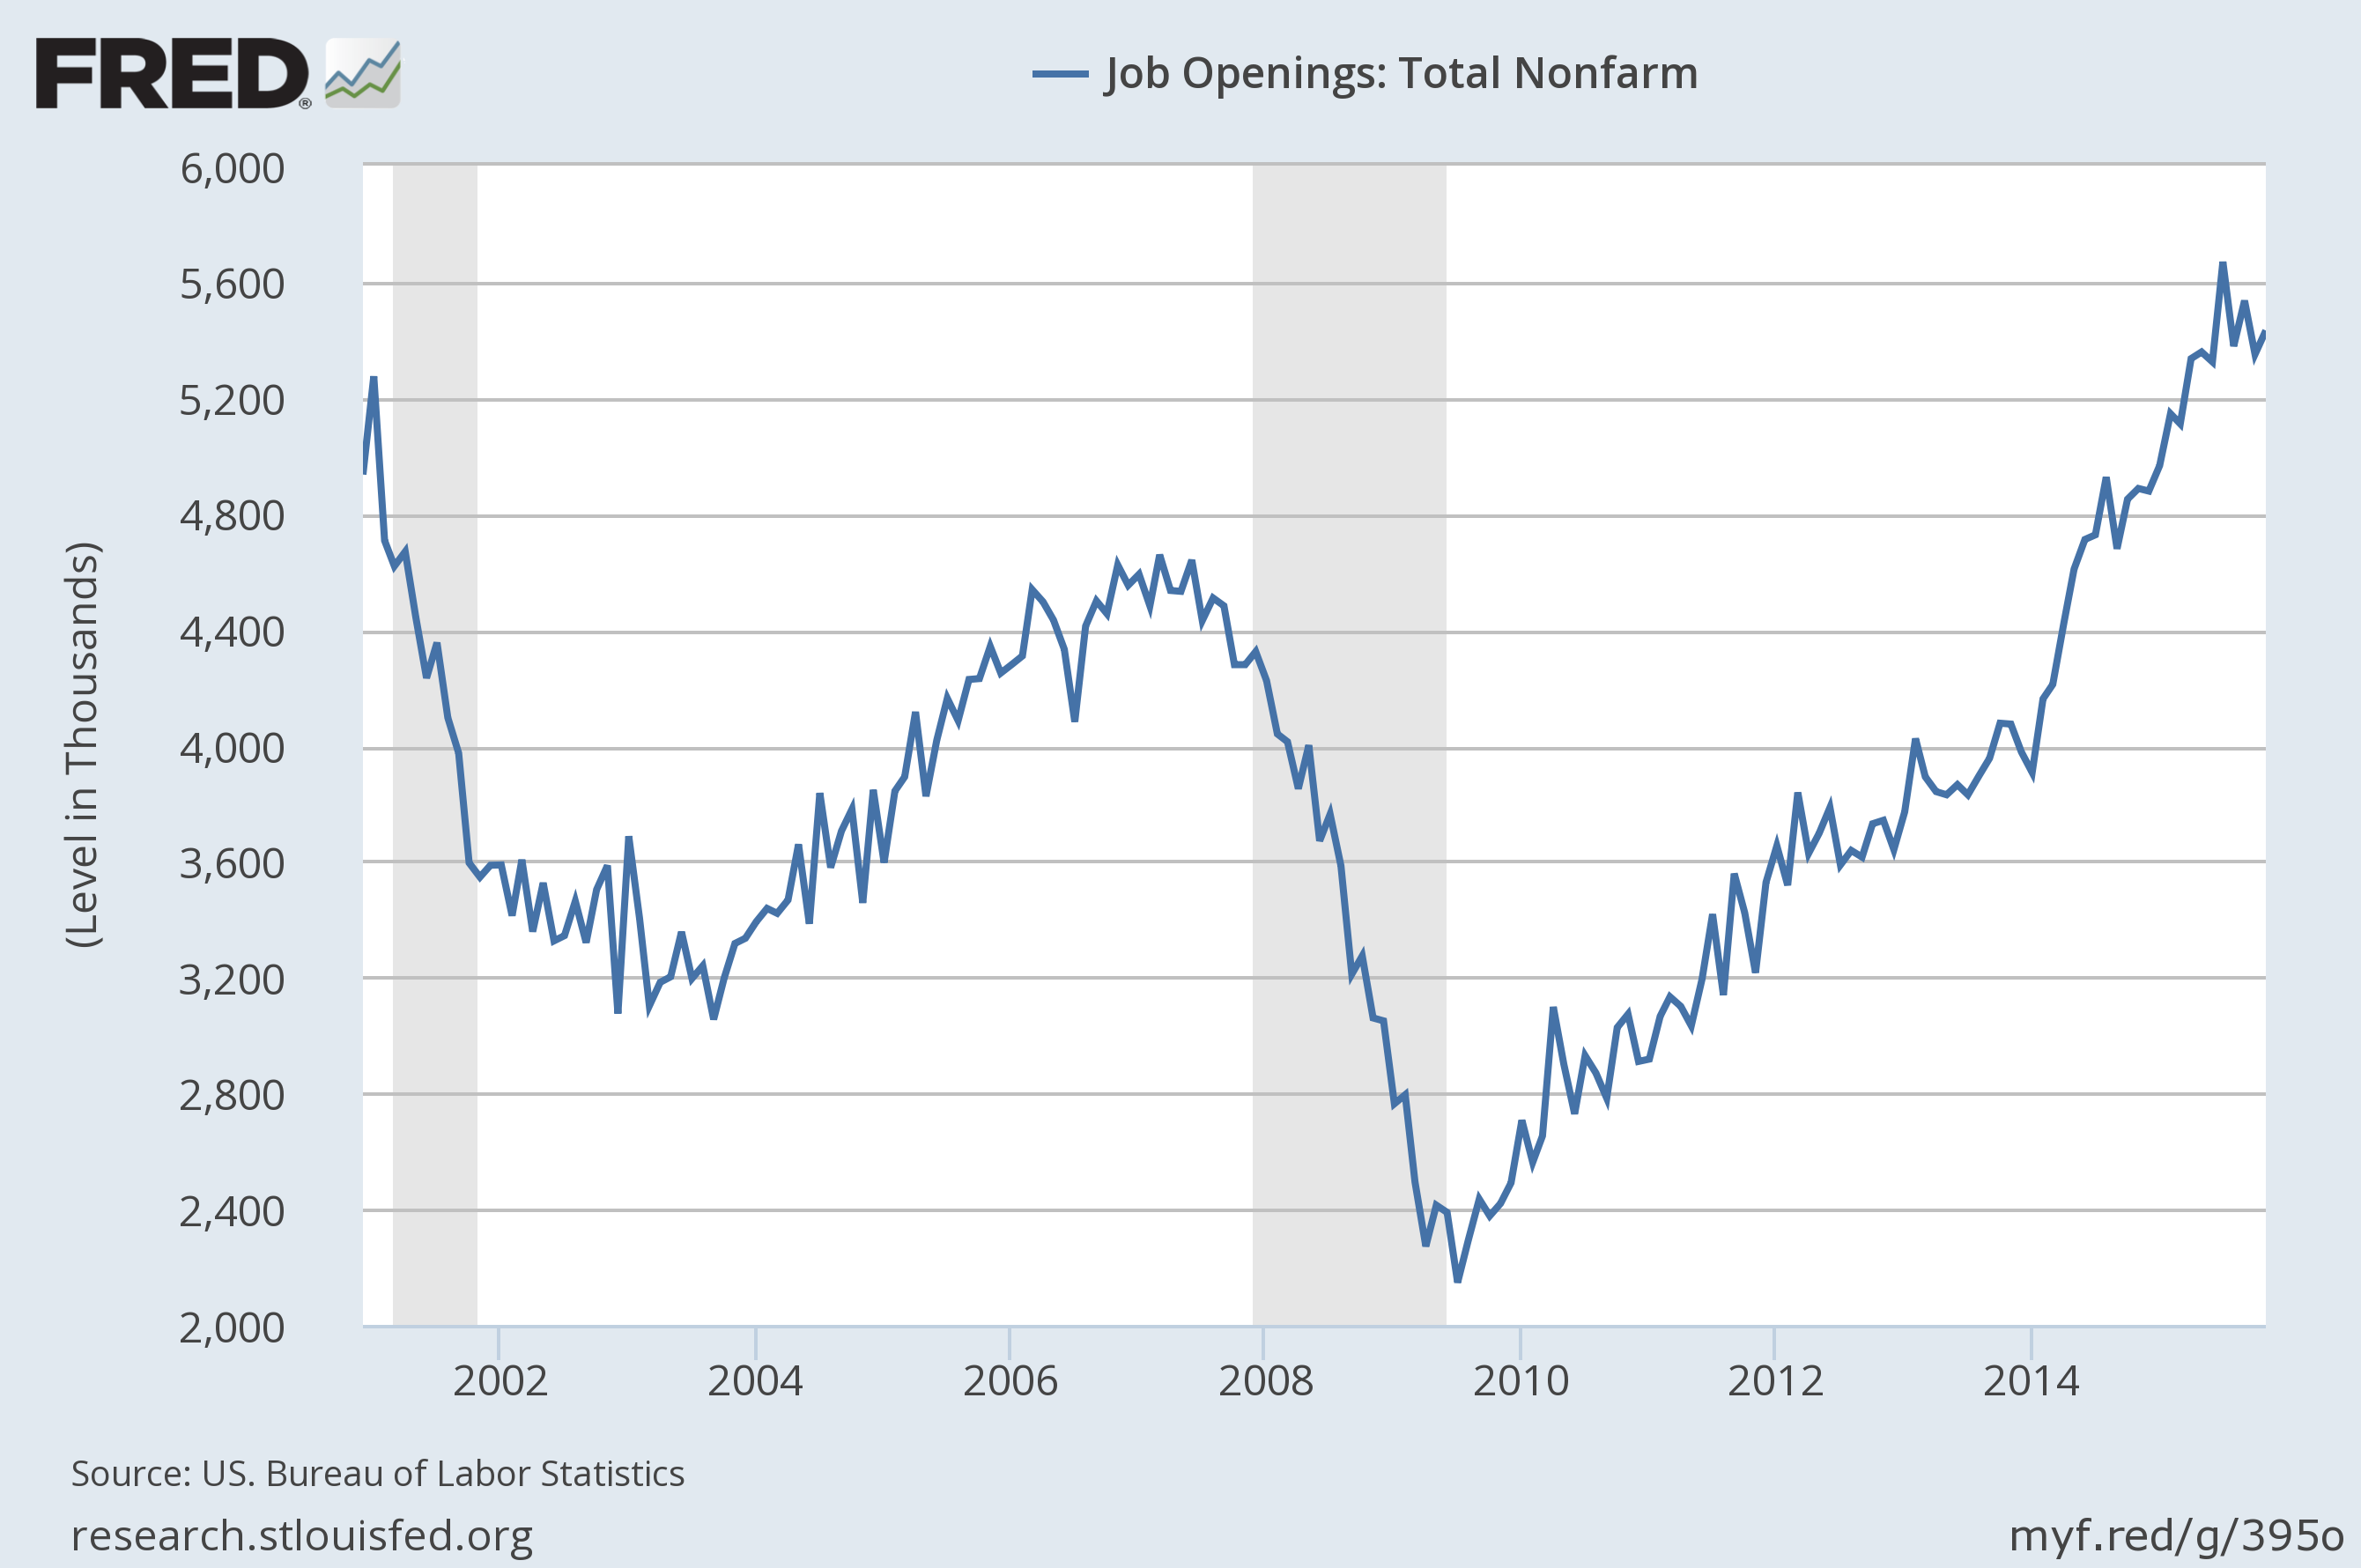
Of course, during any healthy economic expansion there should be wage growth accompanying increased overall employment. It seems that just over the past year wage growth is beginning to pick up some steam as a natural consequence of a tighter employment market requiring skilled labor.
What follows is an excerpt from a Chicago Fed Letter from 2012 describing the Chicago Fed National Financial Conditions Leverage Subindex shown below:
Our measure is constructed as a subindex made up of two nonfinancial leverage measures used in the Chicago Fed’s National Financial Conditions Index (NFCI). We show that this subindex has performed well as a leading indicator for historical periods of financial stress and their accompanying recessions in the United States.
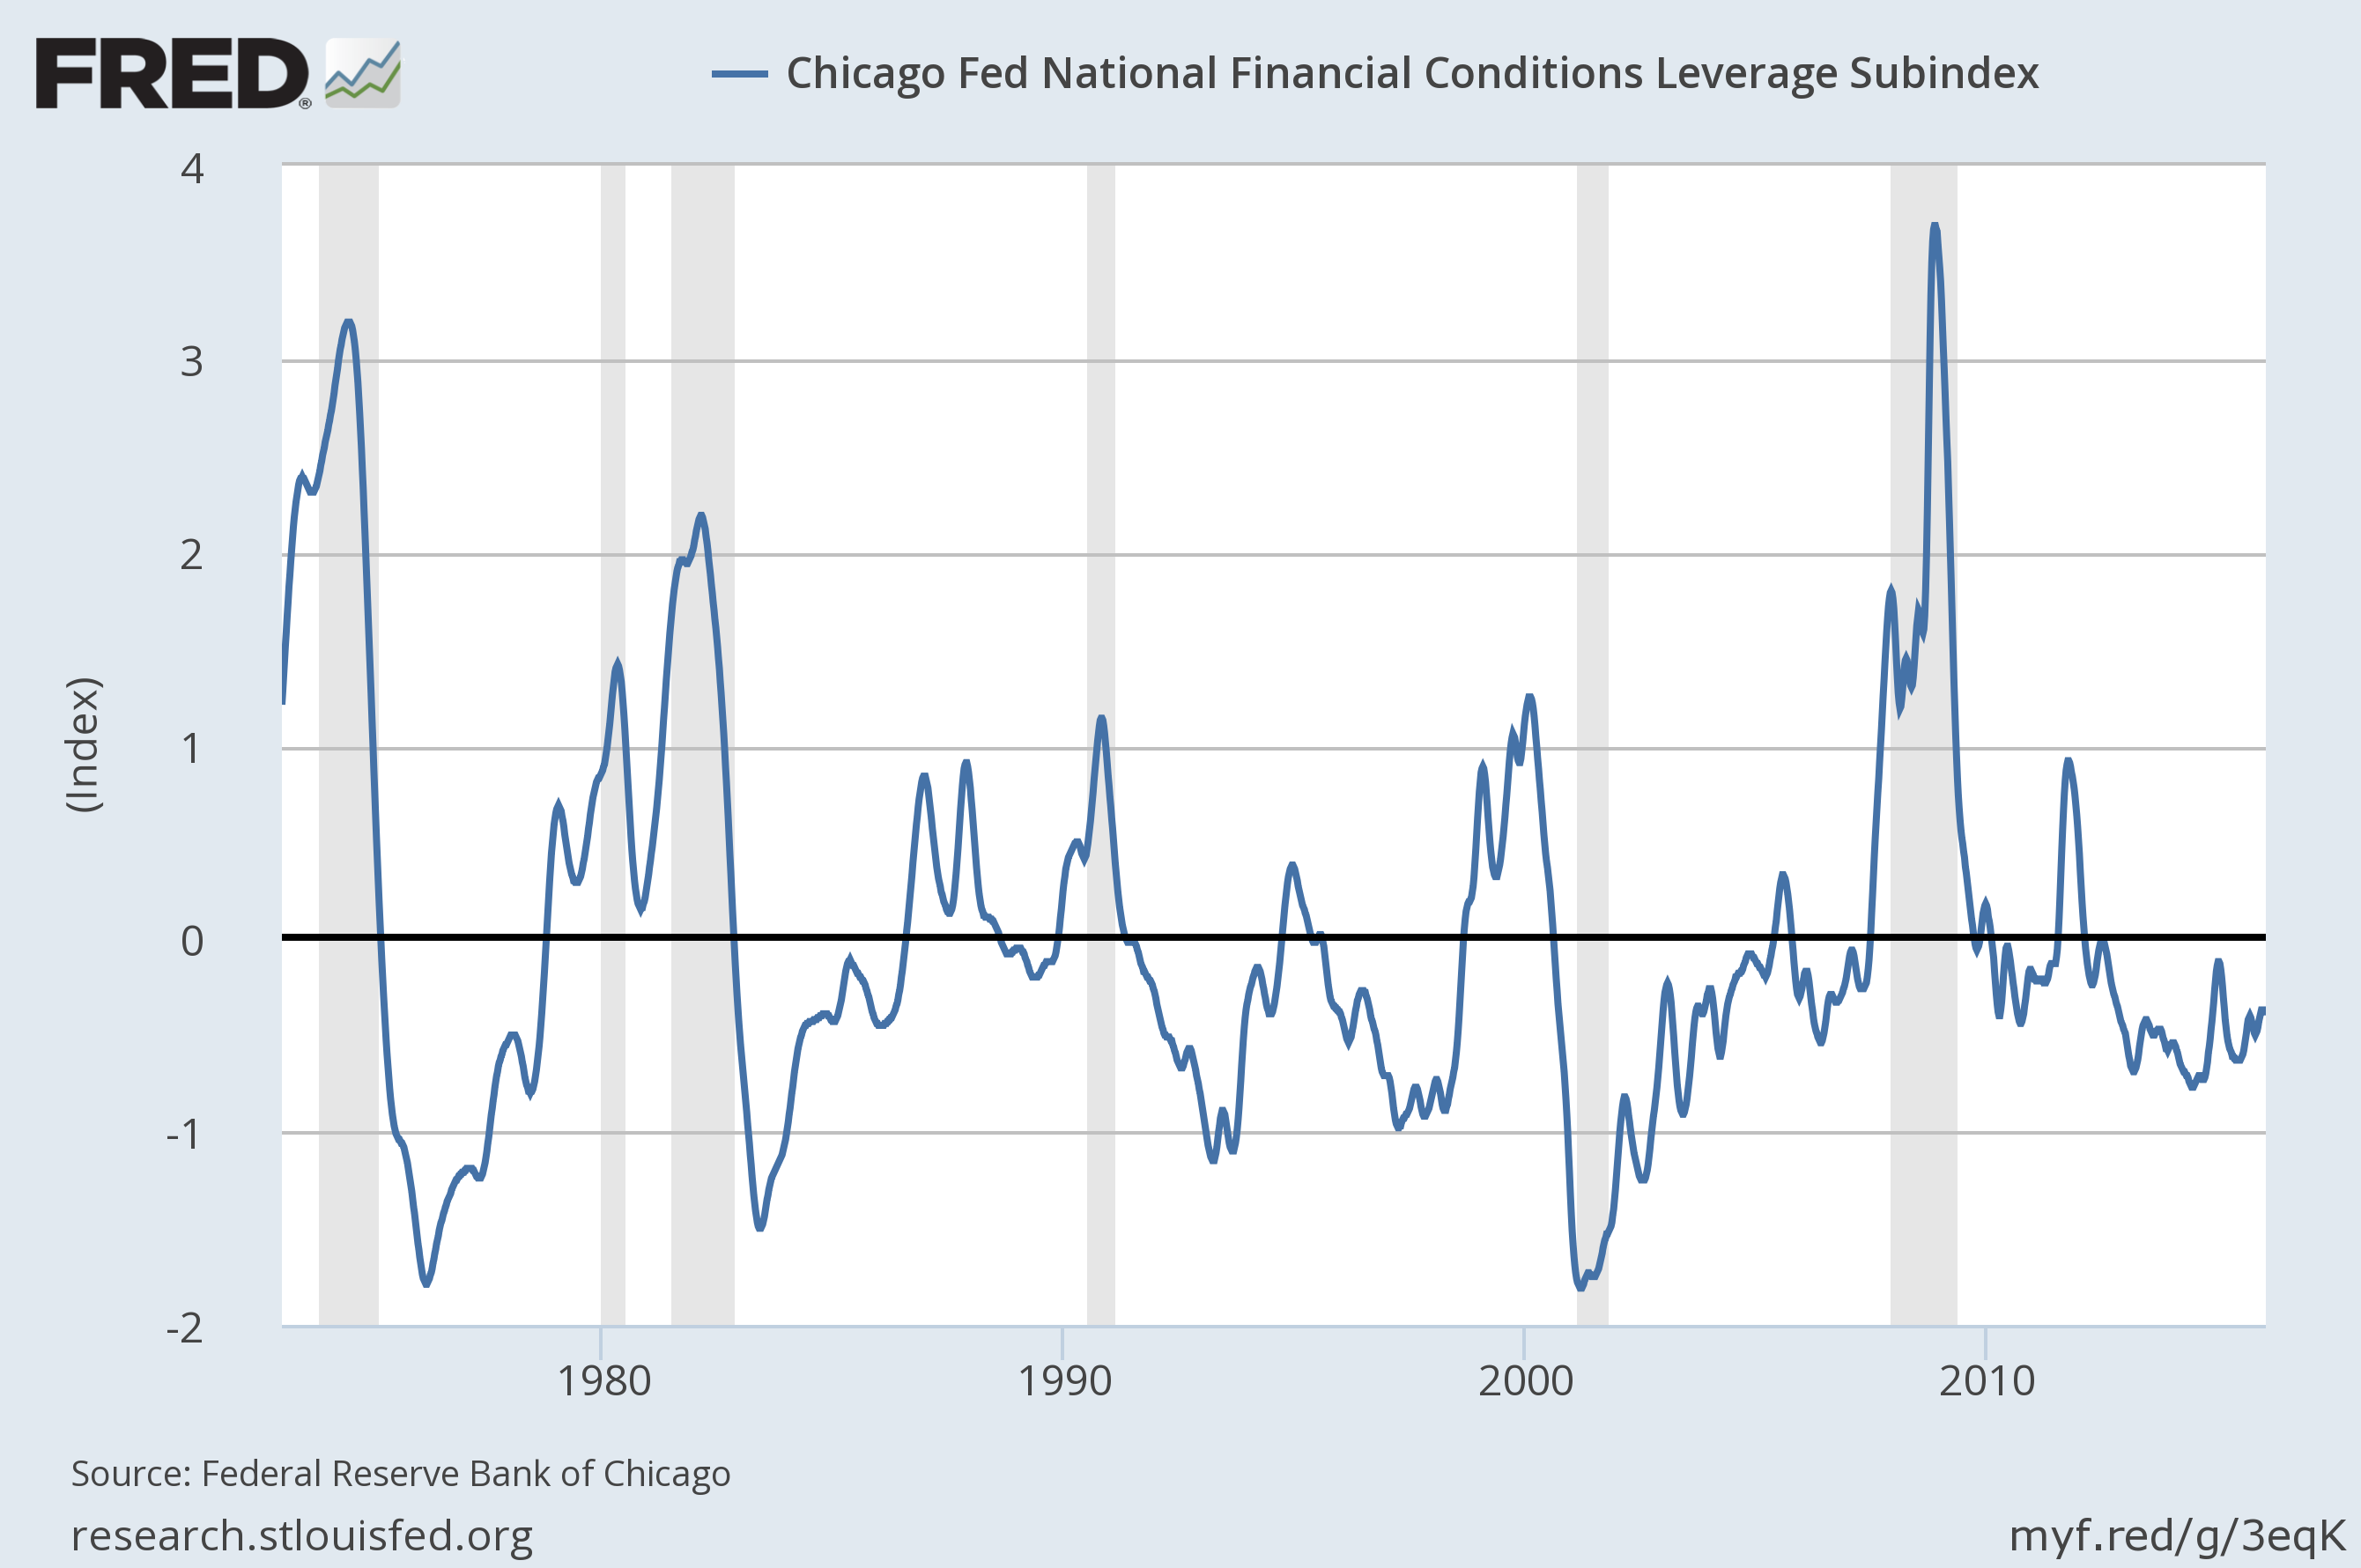
You can see in the shaded areas of the chart that every recession since the 70s has been marked an increase in this leverage subindex. There has not been a single recession going back more than 40 years that started with the index below zero, where it currently resides.
Next up is the percentage change in total public debt as a percentage of GDP:
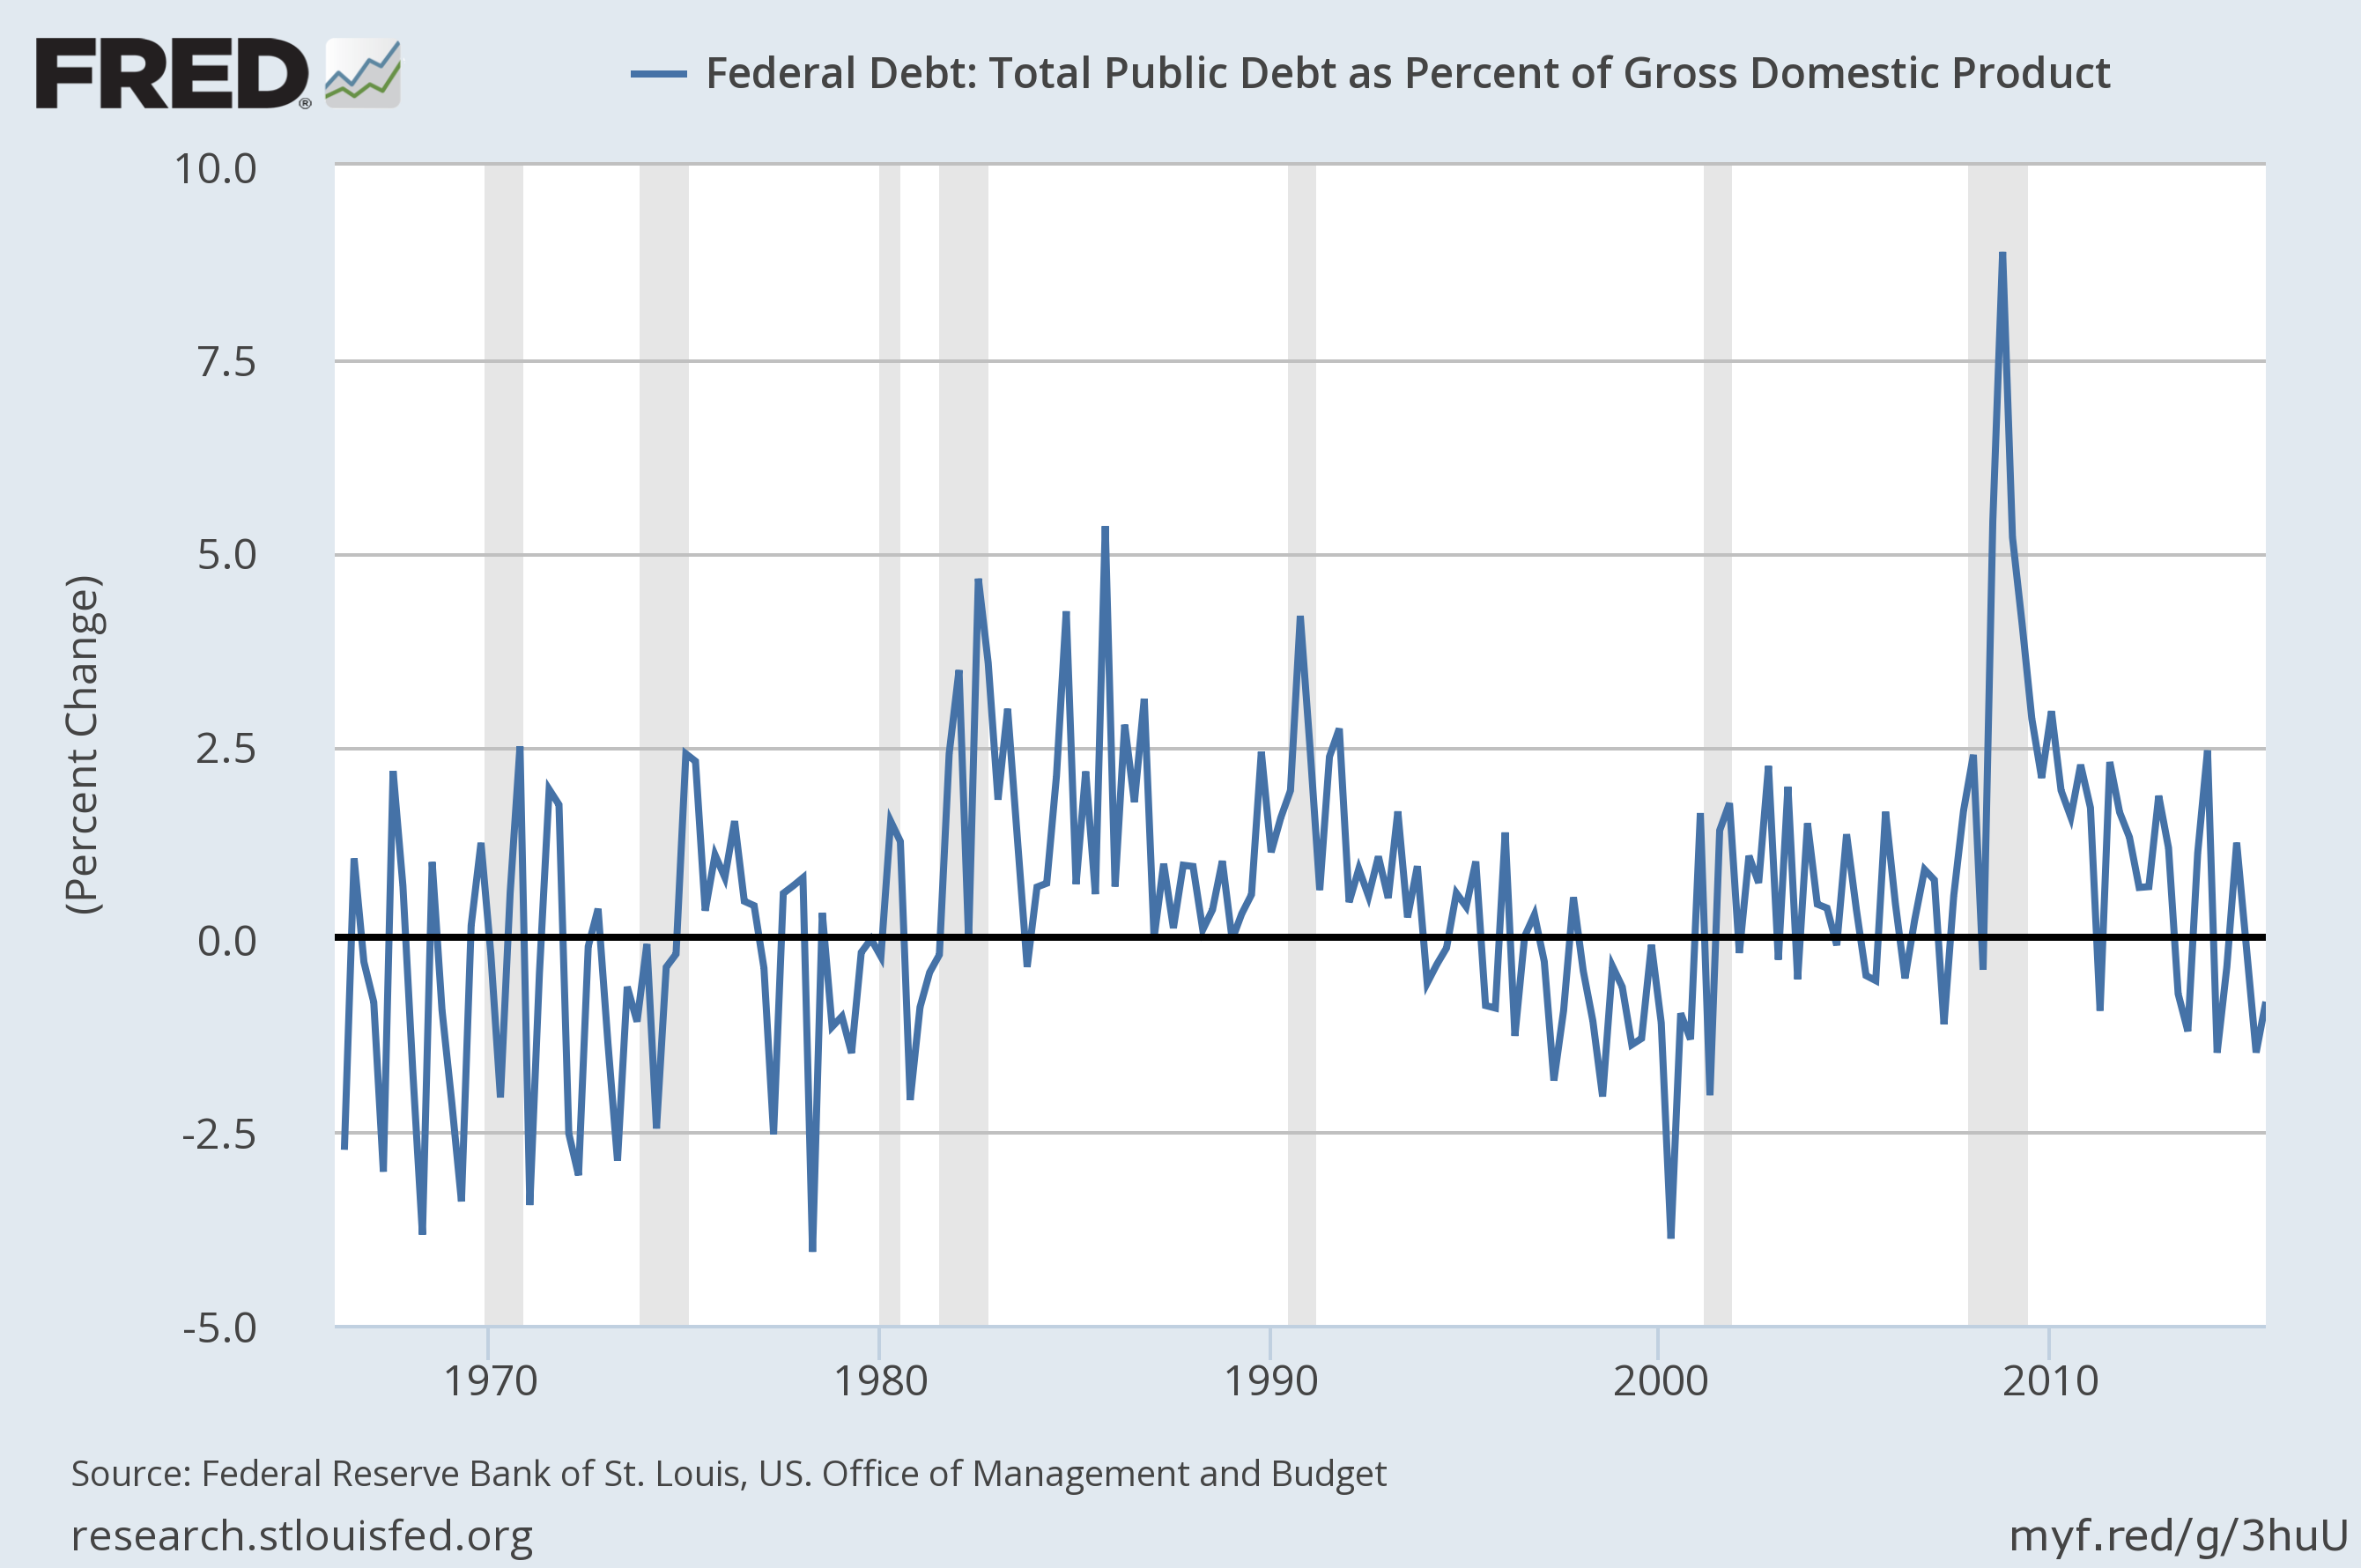
Another indication that financial stress in terms of excessive leverage and concentration simply isn't a part of the current economic equation.
During a recent interview Steve Eisman of “The Big Short” fame was asked about the current risks in the financial system compared to 2008. Here is his response:
If you read the newspapers, sometimes it feels like it could happen again, and from where I sit, that’s just not true. The regulators learned the hard way they were wrong, and they’ve done a lot to correct a lot of the problems. In 2001, Citigroup was levered 22 to 1. In mid-2007, it was levered 33 to 1. Today, it’s levered 10 to 1. The banking system probably hasn’t been this safe in my lifetime.
And this from a recent article regarding the bank sector in Barrons:
“This is an exciting time,” says CLSA banking analyst Mike Mayo.“Bank balance sheets are as strong as they’ve been in decades, and stock prices resemble recession troughs. Earnings are more stable than they have been in decades, and capital ratios are at the highest levels in 80 years.” Credit Suisse analyst Susan Katzke calculates that nine big banks she covers have tangible equity capital ratios averaging 8% now, double the levels in 2007, prior to the recession.
Back to the original question at hand before I posted these charts: Do we have a convergence of assets, both consumer and corporate, that create sudden, systemic vulnerabilities in case of changes in capital flows?
According to the data, we are nowhere near systemic vulnerability in the economy that will compromise the support mechanism created by the post-traumatic stress syndrome of the past decade.
In other words, dips in the major indices should continue to be minor interruptions within a grand secular bull market. They should be used as opportunities to increase exposure as opposed to a reason to embrace fear and uncertainty.
It certainly seems that investors do not understand the aforementioned concept of buying the dips, especially large ones, as inflows into treasury funds have been ongoing for 7 weeks now at months end, with 13.9 billion moving into money markets recently.
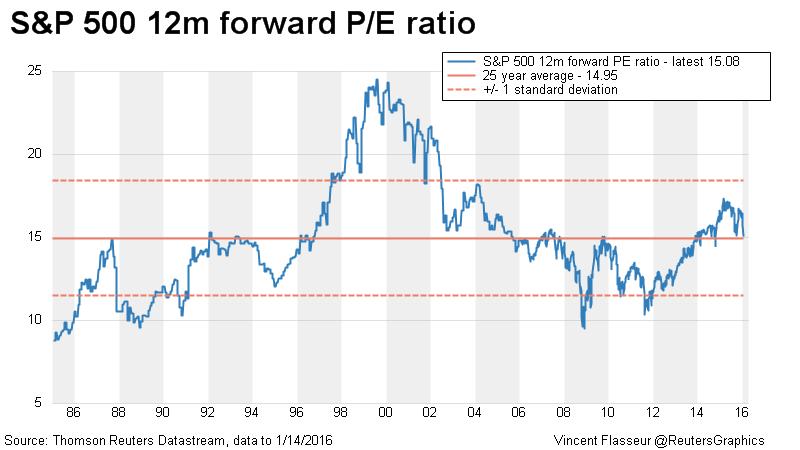
Investors would rather park their funds in a money market yielding close to nothing than equities that are sitting at average valuations within an environment for Treasury Yields that is near record lows. It is important to bear in mind that the 25 year average 15 PE ratio for the S&P 500 was with a Treasury Yield averaging around 4-5%. That 15 PE ratio at the current 2% 10 year yield is therefore highly attractive.
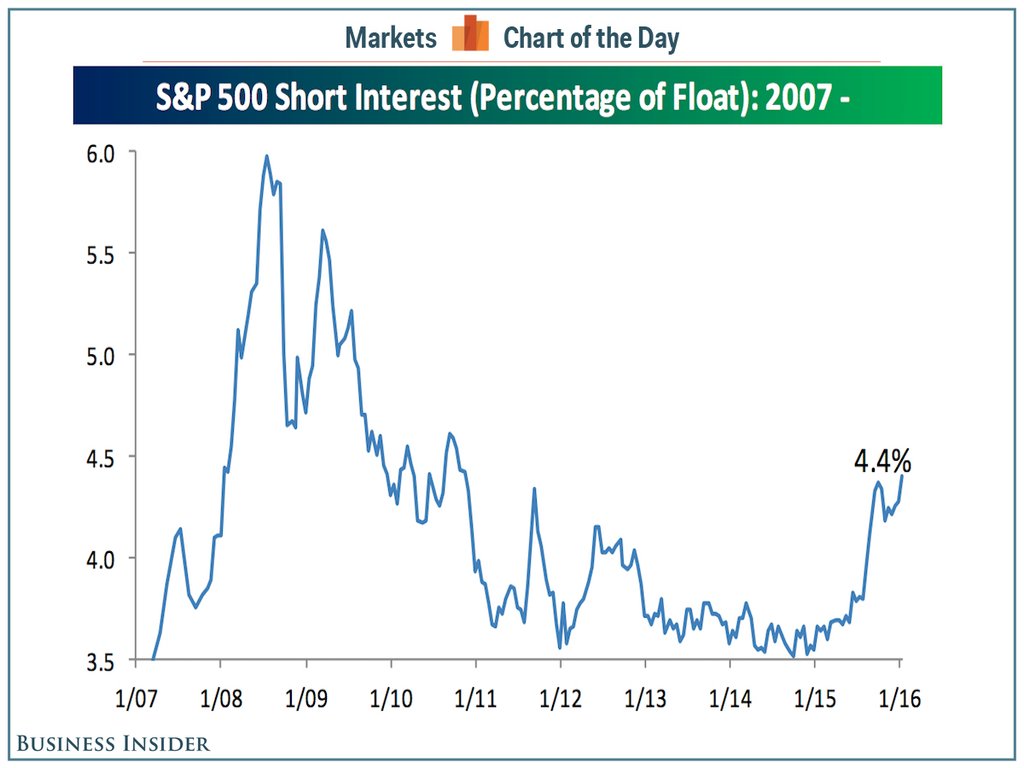
Investors don't seem to understand the valuation concept of an ultra-low rate environment paired with an average PE ratio for the S&P as short interest for the S&P 500 now exceeds any point post-crisis, exceeding the Euro crisis highs of 2011.
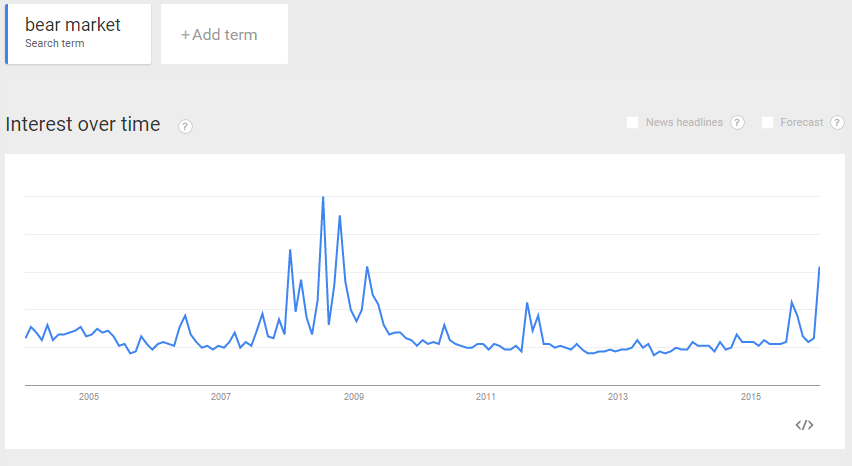
This appetite for short exposure in the S&P 500 matches precisely with the search habits of individuals. Google has shown the greatest spike in searches for “bear market” since, again, the crisis days of 2008-2009, exceeding the Euro of 2011 highs.
It seems that the current mix of exaggerated recession fears brought on by macro worries involving emerging economies and their contribution to the crisis in anything commodity related has been embraced not just by the investment public, but Wall Street as a whole. This, of course, sets the market up for a misallocation and misinformation trade to the upside, as all the assets that are positioned incorrectly due to an erroneous understanding of current circumstances will move from low yielding, fear driven fixed income investments into higher yielding assets, primarily equity securities.
Adopt A Small-Cap Security Today
If small-cap stocks as a whole were able to demonstrate their current state in commercial form for media consumption, they would appear as malnourished, trembling and fearful small animals looking sadly into the camera while being held by an individual with rubber gloves asking for your help to locate a suitable home.
The Russell 2000 has turned into The Humane Society of the stock market, housing unwanted companies that are overlooked and neglected entirely. As a result, an opportunity has presented itself to those seemingly brave investors who decide to expose themselves to such harrowing investments.
While the traditional view of the small-cap environment, especially recently, is one of multi-layered dangerous circumstances, the current opportunity offered in small companies is likely to turn out to be one of the best since the financial crisis and certainly within the last 20 years.
The Russell 2000 in 2015 saw a negative return of 4.41%. For 2016 the Russell has lost nearly 9% year to date. Since 1980 the Russell has only seen two negative years in succession one time and that was during the 2007-2008 crisis. Other than that, negative years for the Russell have always resulted in a positive finishes during the year that follows.
During recessionary periods of 2001 and 2008 the Russell didn't follow the normal path of strong gains following a negative year, as 2001 returned 2.49% and 2008 saw a decline of 33.79%. During non-recessionary periods, however, the gains following a negative year for the Russell 2000 have averaged nearly 30%, making this current January decline in small company shares an extremely relevant buying opportunity for investors.
There is substantial probability based on these statistics and the symphony of data provided throughout this letter that the negative bar showing a decline of 8.85% for the Russell in 2016 will end up strongly in the plus column come year end.
With that said, putting cash to work in attractive small companies while seemingly dangerous on the surface given pervasive negative sentiment is a highly attractive proposition from all conceivable angles.
Throughout the month of January, I rotated portfolio assets out of already attractive investments into an even more attractive investment. This company constituted enough of an attractive valuation proposition that I also put whatever remaining cash we had coming into January to work, ending the month with a basically 100% long position in the portfolios.
It is true to be successful over long periods in the markets, you must be willing to take on risks that seem unreasonable at the time but in hindsight turn out to be perfectly reasonable given circumstances that become lost in emotion by the majority. With shares of small companies being trampled on while investors move to the exits, they are overlooking opportunities that possess upside far in excess of any downside risk. As usual, investors will confuse emotion with fact during a time period when opportunity is rife and risk is absent.
Our fully-invested, concentrated current allocation is a statement of opportunity and most importantly, skepticism with regard to any consensus investment opinions.
Regards,
Ali Meshkati