THE PIECES ARE FALLING INTO PLACE FOR A MOVE TO THE OCTOBER LOWS
In order to gain an accurate appreciation for where the market is going, it is important to look back at what has been said. With the overwhelming abundance of information available to us, it is nearly impossible to remember the analytic road map that got you to whatever frame of mind you are in with respect to the market. This is why I find it imperative to keep this blog updated, as well as take personal notes, in order to realize where my current frame of thought is originating from. Without these valuable journals, I am left with an abundance of thoughts each and every day that remain uncatalogued and disorganized.
I believe we are reasonably close to a point in the time for the markets where an intermediate term top will be seen. This top will give way to a test of the October lows within the coming 1-2 months. I don't simply base this on the study I posted Thursday night with respect to the topping formation on the weekly chart for the S&P. I base it on analysis that was born in mid-November with this article explaining the reasons why I believed we were on our way towards testing the October lows.
A day after publishing that article, I published a follow up note explaining how sentiment was still not in the proper place to reward the bears with a dramatic move down. That article is here. I have been following the sentiment picture very closely, as it holds the key to cultivating an environment where a retest is possible.
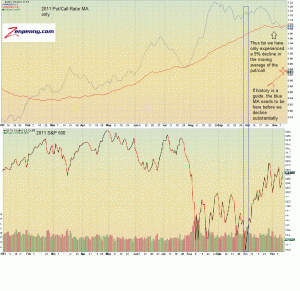
Let's look at how the sentiment picture has changed, not via surveys or odd indicators of money flow, but with real money data utilizing the put/call ratio. In order to gain some sense of where we are currently vs. where we have come from, the first chart and notes are from mid-November. I use the moving average of the put/call ratio ONLY in order to smooth out the data:
click chart to enlarge
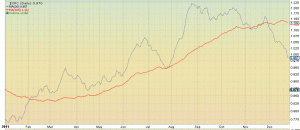
My article from November 13th was titled "The Next Leg Down Will Begin Once This Indicator Falls In Line". As of Friday's close we are 1-2 days away from the indicator moving into a territory that allows the sentiment picture to accommodate a drop back to the October lows. You can see in the current chart of the put/call, the 20 day moving average has plummeted recently without new intermediate term highs being observed in the markets.
This highly reliable sentiment study along with price patterns and the suspect price action during bull moves, makes me believe that it is not a matter of IF we revisit the October lows, it is only a matter of WHEN. The question of when is answered by sentiment more accurately than any other indicator. Sentiment is about the fall in place for the first time since the European blowup commenced in August.
The first quarter of 2012 will start with a trip down memory lane to the October lows. Position accordingly.


