WHY CURRENT PRICE ACTION MAKES ME BELIEVE WE WILL REVISIT THE OCTOBER LOWS
During times of confusion in the marketplace, I have found it beneficial to clear my focus through the elimination of all methods of analysis but one. The attention to price action is what has allowed my success in the past and will do so in the future. For that reason I am giving up my biases - every single one of them - in favor of looking at the market from only a price action standpoint. What is the market telling me? That's what I want to know. Here is what I have come up with thus far:
1. The consolidation we have seen occur over the past couple of weeks in the S&P is not your typical "crunch, rest and explode" pattern that you see in healthy bull markets. A healthy consolidation does not have 1000 point swings in the Dow during a week that end up bringing the average to basically unchanged for the week when all is said and done. That's what happened this week. This type of volatility, marked by a proclivity towards random acts of violence, is the sign of a significant turning point.
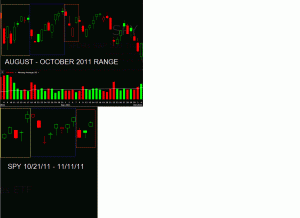
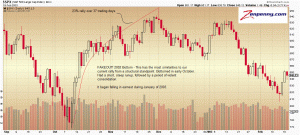
We don't have to look back far to see when this last occurred. In fact, it was only a couple months back within the range we just exited from. If you look at the current range that is forming, compared to the August - September time period in the S&P, the similarities are notable.
click chart to enlarge
The point here is that what we are seeing now is not consistent with a continuation pattern, but rather a pattern that seeks to change the trend in a violent manner. We saw that violent change of trend take place with the October 4th bottom after the choppy consolidation that had the bears thinking we were headed for sub-1000. Now we are starting to see the same action here. The change in trend, however, will come in the opposite direction as the October bottom.
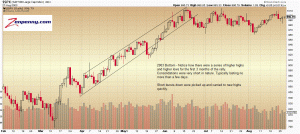
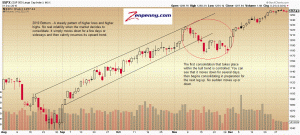
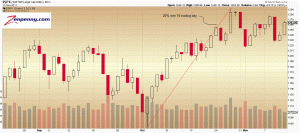
2. Healthy bull markets off of "real" bottoms have a tendency towards moves that see the averages move up in steady bursts, followed by short periods of consolidation. NONE of the moves are marked by excessive volatility within a wide range. Especially in the first few months of the move up.
Here are some examples of "real" bottoms that have taken place over the past decade:
click chart to enlarge
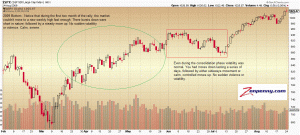
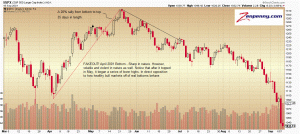
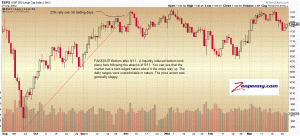
3. A move that is made off of a market bottom that proves unsustainable is typically marked by excessive periods of consolidation that contain volatility. The moves are sharp in nature, which is consistent with both real bottoms and fake bottoms. However, what separates the real from the fake is the fact that the real see a general calm about them during periods of uncertainty (consolidation). The fake bottoms see a general sense of uneasiness as expressed through the price action whenever the upward momentum stops. This results in sloppy consolidations, similar to what we are experiencing currently.
Here are some examples of fakeouts from the past decade:
click chart to enlarge
Now that we've seen the real and the fake, let's look at the current market:
From a purely price action standpoint, after taking a look at the relevant data, I am now changing my stance to intermediate term bearish from bullish. I will be looking for selective opportunities to initiate short positions over the coming weeks. According to past data, a move to 1300 on the S&P isn't out of the question before the final top is seen. That should happen before the end of this month.
I have more data to back up my change in bias. I will be presenting those points later.

