5 CHARTS THAT DEMONSTRATE THE INCREASINGLY BULLISH SENTIMENT IN THE FACE OF PRICE EROSION
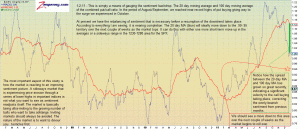
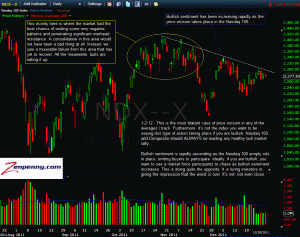
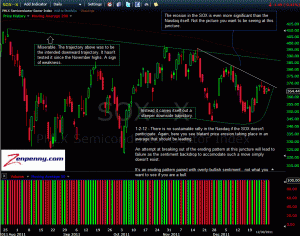
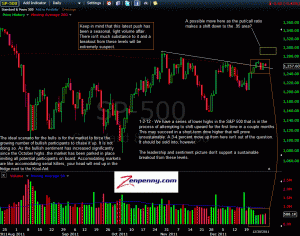
The first chart is the combined put/call ratio. It is the foundation for a majority of my sentiment analysis. I use different timeframes, along with numerous indicators in an attempt to gauge if the money is flowing to the bull or bear side. Generally, it is important to see an uptrending market paired with a downtrending put/call ratio as we have in the chart below. You DO NOT want to see price erosion taking place in important, leading averages while bullish sentiment is bouncing off the walls.
Why? If the market should negate the bearish patterns in the popular market averages, then the firepower simply won't be there for a sustained move higher. Instead, it will be a failed move that serves to reinforce the negative price patterns.
Odds are strongly weighted towards any move up in the first couple days or weeks of January being an excellent selling opportunity if that is what the market has in mind.
click chart to enlarge

