A FASCINATING INTERPRETATION OF THE PUT/CALL RATIO: VOLUME 1
Those of you who have been following my postings for more than a few weeks know that I am fond of interpreting the put/call ratio as a means of gauging market psychology and spotting potential reversal points in the market. I have come up with many methods of interpreting the put/call ratio based on different studies relating to trend, seasonality, volume, mean reversion and length of time.
I wanted to share one study as it pertains to the current market environment. I have determined that not only is it important to look at the levels of the put/call ratio but the characteristics the indicator exhibits as it moves up and down through different phases of the market.
I use varying moving averages only for my put/call studies. The raw data is too erratic and needs to be averaged out over periods of time. The studies are always a work in progress. The more I investigate them, the more nuances I find in seemingly straightforward data points. One recent discovery is that extreme levels of pessimism as measured by the put/call will obviously have different rates of reverting back to their means once sensibility returns to the market. The rate of reversion can give important clues as to the intention of the market.
It makes perfect sense too. If participants are jaded enough by the recent price action, they will take their foot off of the put buying pedal but will be hesitant to go full steam into buying calls. This causes the moving averages of the put/call ratio fade slowly over a period of months instead weeks.
On the other hand, if market participants are optimistic about a recovery, the reversion of the moving average will take place much more quickly. This opens up the market to weakness much earlier than the former example since market participants are loading up on calls while shunning puts, thinking that the worst is indeed behind us.
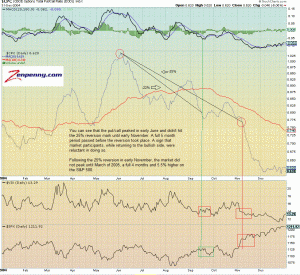
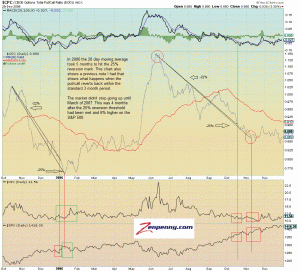
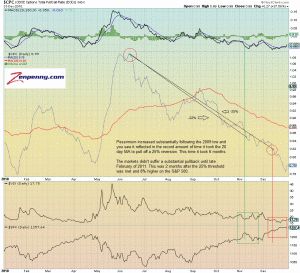
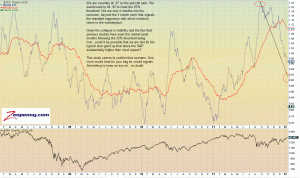
In a majority of the cases, the reversion of the put/call ratios takes the speedier route, most often not taking anymore than 3 months to hit the fateful 25% reversion (20 day MA) from the high mark. I have found that between 22% and 25% reversion is where the greatest potential for the market to begin showing weakness lies. That is UNLESS the reversion takes longer than 3 months. If the 25% threshold takes longer than 3 months to meet, then market weakness seems to start at a much later date. The markets basically continue grinding up right through the bullish sentiment.
Here are three of the most recent examples in 2004, 2006 and 2010. The study looks for peaks in the put/call ratio followed by 25% reversions from the peak within a 3 month period in order to look for points where excessive bullishness will lead to weakness. All of the examples below have taken longer than the 3 month standard threshold to meet the 25% reversion:
click chart to enlarge


