THE POWER OF GENERATIONAL TRENDLINES AND WHAT THEY MEAN FOR THE CURRENT MARKET
I speak about generational trendlines now and then. I define them as trendlines that exert their influence over long periods of time that span multiple investing generations. These trendlines can often have origins that go back many decades.
When the S&P was battling with the 1230 level from August until nearly the end of 2011, there was a generational trendline sitting right in the middle of that range dating back to the early 1970's. That trendline marked the bottom for the 1987 crash. The bottom for the 90/91 market that saw the "tech boom" kickoff soon thereafter. Its influence was obviously felt during the second half of 2011 as the 1230 level was a consistent battle zone between the bulls and the bears.
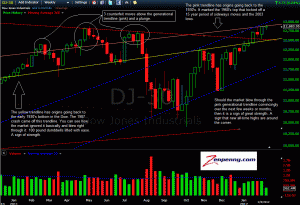
The Dow has been battling the same types of generational trendlines since the 2011 top. The origins of the pink trendline that you see in the chart below go back to the 1930's for the Dow. This trendline marked the 1966 top that led to a 15 year sideways range for the Dow. It marked the 2003 low that saw the markets rise into the 2007 top.
These trendlines should never be used as absolute points of support or resistance. Rather they should be used as guideposts or benchmarks to gauge how strong or a weak a market is currently. Think of them as 100 pound dumbbells that the market has to lift. If the market lifts the dumbbell with ease, meaning that it breaks out over a generational resistance line, as an example, then the market can be deemed as strong. If, however, the market breaks down violently off of the generational trendline, then the market can be deemed as being weak since it dropped the weight.
You can see in the chart below we are right up on the pink trendline and consolidating below it. This leads me to believe that the Dow wants to break up through the trendline, above 13,000. You can see that the Dow had three counterfeit moves about the generational trendline in 2011 before breaking down severely. This was much like the three counterfeit moves below the trendline that I outlined in the "Most Important Chart I've Ever Posted" posting in mid-December.
It could be that the Dow wants to break up through the trendline and then break down for a correction before trying to move up in a substantial manner later this year. It could also be that the Dow simply breaks up through the generational trendline and accelerates, not looking back. The latter scenario is highly bullish. Highly bullish doesn't do it justice. It is a monstrously bullish scenario that indicates all-time highs for the Dow are around the corner.
Here is the chart:
click chart to enlarge


