TWO CHARTS ILLUSTRATING HOW BEARISH TUESDAY’S ACTION REALLY WAS
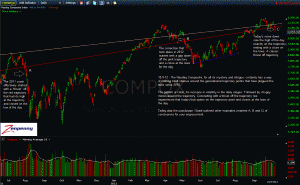
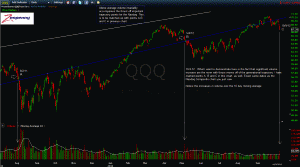
Two illustrations of the importance of today's breakdown in technology.
The first chart will show how symmetrical the breakdown was, with respect to the "thrust" that occurred off of the key trajectory point on the Nasdaq. The thrust was further validated by a close on the lows. This is fairly classic behavior for a market is set to experience a change in trend.
The second chart will show how the breakdown in technology was accompanied by a significant volume uptick in the QQQ. This further validates the breakdown.
I have been speaking of the various warning signs that the market has been exhibiting for two weeks now, mainly in my weekly chart reviews. What the markets experienced today was no longer a warning, but rather a direct shot into the headquarters of the bulls. This means we are no longer sitting in a peaceful stage of existence in the financial markets. There will be some very serious sideways volatility over the next several weeks. That is a best case scenario.
I believe a sudden reversal back up is out of the question for the remainder of October. The worst case scenario is a rather severe drop in the coming weeks. For the first time this year, I am willing to entertain the possibility of a waterfall decline or even a crash. I don't like using such words, as they stir up emotional reactions in investors that are often times unwarranted. All I am saying is that the possibility, in my analysis, has gone from being basically nonexistent to having some remote probability.
Be extremely careful initiating long positions. Time to be defensive.
click chart to enlarge


