
What follows is an excerpt from yesterday's Market Update, sent to subscribers, discussing the reasons the S&P was going to accelerate in the days ahead. To become a client of Zenolytics Turning Points or to learn more click here.
The markets have moved through another period where the bears had an opportunity to seize some semblance of control. Once again, they have failed miserably in the first two days of trading in the new month.
These type of failures by the bearish camp around key spots have served as signals that have been worth their weight in gold since the March lows. This time has a high probability of being much the same.
To put it simply, the bears had a window in time coming into August as the markets were up against resistance to turn the bulls around. It's not, however, just the failure of the bearish camp that's important, it's the manner in which the markets are choosing to proceed.
Let's look at the chart for the S&P in order to better understand the importance of the path of progress:
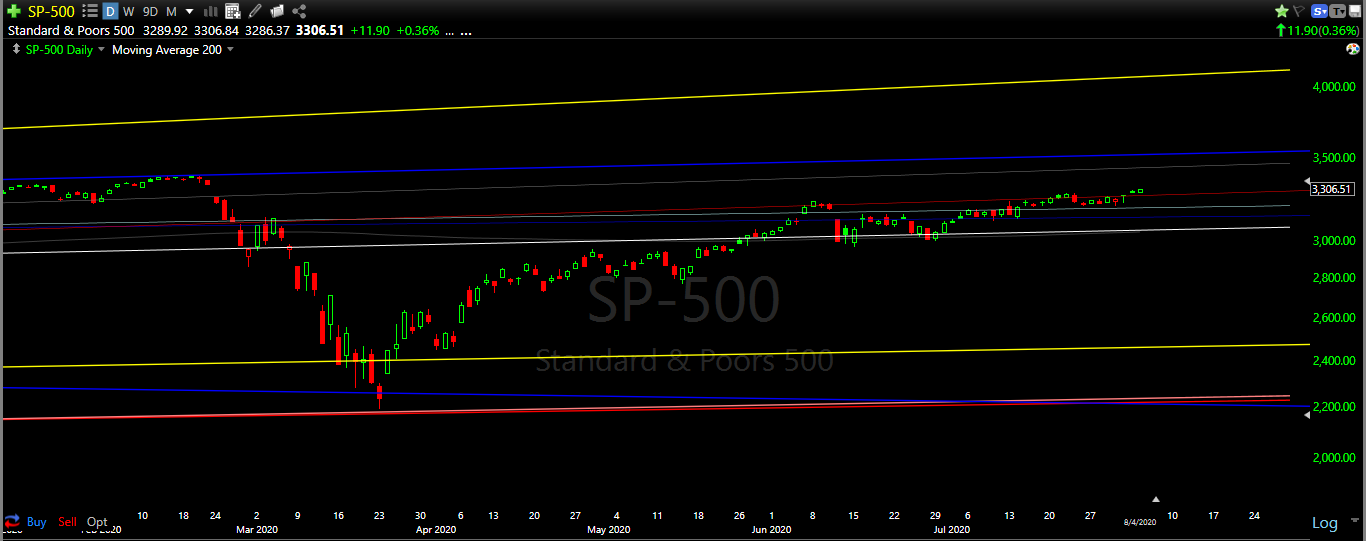
This is the only chart we need to review tonight as it tells an investor everything they need to know. The nature of the movement in the S&P to start this week here is astounding on so many levels:
1. Notice the calm, deliberate manner the market just busted out of the resistance zone it has struggled with over the past couple of months. This is a massive continuation pattern/signal, suggesting a ton of accumulation beneath the surface.
2. The S&P closed at 3306 today. The lack of volatility while piercing a round number is also a signal, especially as we are so close to new all-time highs. Round numbers on major averages attract investor attention. That attention normally brings in both buyers AND sellers. In this case, it looks like only buyers, with very light selling. Another continuation pattern.
3. The daily range is seeing compression during the ascent, as witnessed during the past two trading days. Another continuation signal.
What makes this pattern so attractive from a trading perspective is that we have the S&P cornered here from a behavioral perspective. We know that this low volatility ascent should culminate in either further low volatility upside OR an expansion of volatility on the upside to quickly reach the 3500-3600 level, which I outlined as an upside target for the S&P by August 15th some weeks ago.
Should the S&P suffer a range expansion on the downside, then we immediately know that something is wrong, allowing us to hit the eject button with minimal overall damage. It's a very binary equation from here, making the trade a relatively simple one from a management perspective.
To view the entirety of this weekend's note, you can subscribe by clicking here.
Disclaimer
This website is for informational purposes only and does not constitute a complete description of our investment advisory services. No information contained on this website constitutes investment advice.
This website should not be considered a solicitation, offer or recommendation for the purchase or sale of any securities or other financial products and services discussed herein. Viewers of this website will not be considered clients of T11 Capital Management LLC just by virtue of access to this website.
T11 Capital Management LLC only conducts business in jurisdictions where licensed, registered, or where an applicable registration exemption or exclusion exists. Information contained herein is not intended for persons in any jurisdiction where such distribution or use would be contrary to the laws or regulations of that jurisdiction, or which would subject T11 Capital Management LLC to any unintended registration requirements. Visitors to this site should not construe any discussion or information contained herein as personalized advice from T11 Capital Management LLC. Visitors should discuss the personal applicability of the specific products, services, strategies, or issues posted herein with a professional advisor of his or her choosing.
Information throughout this site, whether stock quotes, charts, articles, or any other statement or statements regarding capital markets or other financial information, is obtained from sources which we, and our suppliers believe reliable, but we do not warrant or guarantee the timeliness or accuracy of this information. Neither our information providers nor we shall be liable for any errors or inaccuracies, regardless of cause, or the lack of timeliness of, or for any delay or interruption in, the transmission thereof to the user. With respect to information regarding financial performance, nothing on this website should be interpreted as a statement or implication that past results are an indication of future performance.