
In this weekend's 328th edition of Turning Points we have a 16 page note going over the numerous distribution patterns showing up in the market after nearly two years of sideways consolidation and what they could mean for the weeks and months ahead.
What follows is an excerpt from this weekend's note.
MARKET UPDATE
During times like this, the best course of action is always to simplify to the greatest degree possible.
It doesn't get any simpler than the chart of the S&P 500.
For this chart, I have intentionally highlighted the 4200-4350 level. More specifically, the resistance envelope (red, gray, white trajectory lines) that exists in that range. More than anything else, this highlights a very real problem for the markets moving forward. I'll explain why. First, here is the chart:
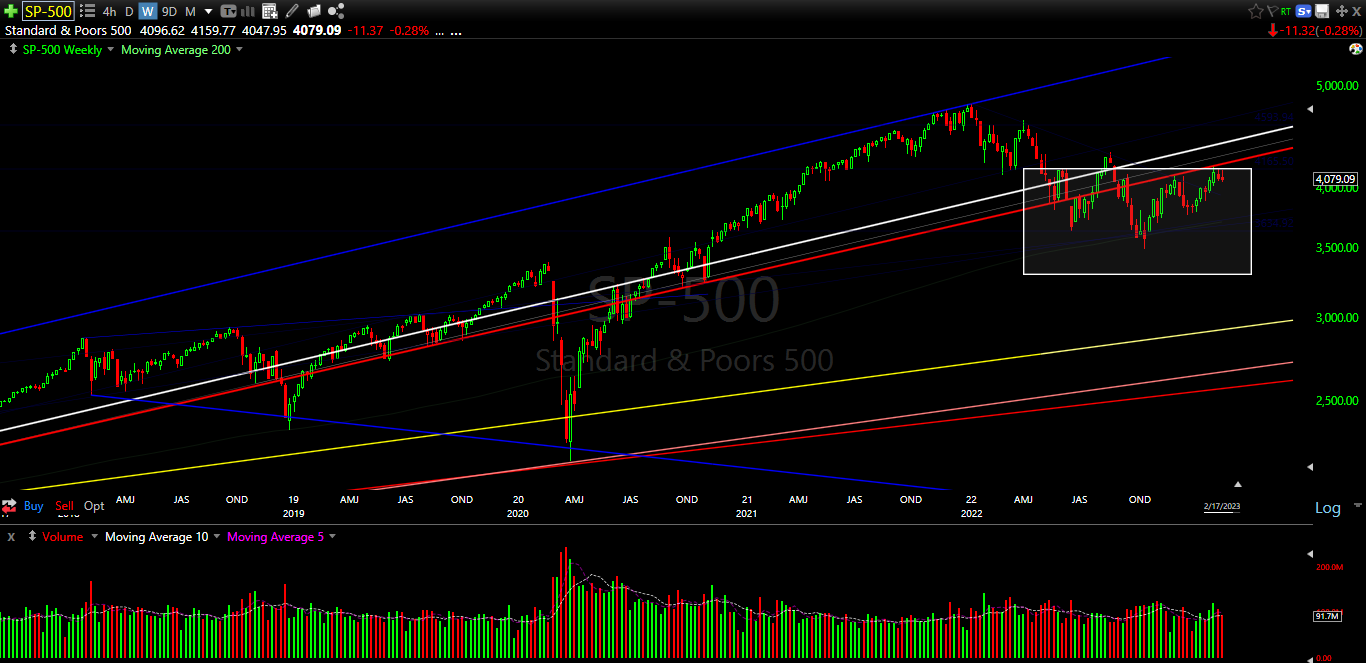
I have purposely lightened a majority of the technical support/resistance points on this chart so that the red and white trajectories stand out.
You will immediately notice on this weekly chart that going back to December 2018 (the infamous taper tantrum), March 2020 (pandemic panic) and 2022, whenever this series of trajectories has broken from above, the markets have become extremely slippery, extremely fast.
These trajectories go back to 2008/2009, carrying quite a bit of weight for the entirety of this bull market. They are extremely relevant, in other words.
I have been discussing speed and time being of the essence for the markets since the beginning of this year. The S&P chart above and more specifically, the manner in which the market is consolidating below the red and white trajectory points is the reason.
For example, you can see that during the December 2018 panic, the market realized time was of the essence, quickly regaining the trajectory.
You can see that during the March 2020 panic, the market realized time was of essence, quickly regaining the trajectory, despite moving well below it during the pandemic crash.
This time is very different, however. Investors are not bidding up the markets in a frenzied fashion as they have in the past. Instead they are slowly distributing stock over time. A distribution pattern. And it's a very significant one, in fact.
The significance comes from where it is occurring along with the length of time that it is taking. The breakdown of such a pattern carries technical consequences that are extreme in nature.
To view the entirety of this weekend's note, you can subscribe by clicking here.
Zenolytics Turning Points is 300+ editions in and only getting better. Find out why institutions and individual investors have come to depend on our service through each and every type of market environment. Click here for details.
Disclaimer
This website is for informational purposes only and does not constitute a complete description of our investment advisory services. No information contained on this website constitutes investment advice.
This website should not be considered a solicitation, offer or recommendation for the purchase or sale of any securities or other financial products and services discussed herein. Viewers of this website will not be considered clients of T11 Capital Management LLC just by virtue of access to this website.
T11 Capital Management LLC only conducts business in jurisdictions where licensed, registered, or where an applicable registration exemption or exclusion exists. Information contained herein is not intended for persons in any jurisdiction where such distribution or use would be contrary to the laws or regulations of that jurisdiction, or which would subject T11 Capital Management LLC to any unintended registration requirements. Visitors to this site should not construe any discussion or information contained herein as personalized advice from T11 Capital Management LLC. Visitors should discuss the personal applicability of the specific products, services, strategies, or issues posted herein with a professional advisor of his or her choosing.
Information throughout this site, whether stock quotes, charts, articles, or any other statement or statements regarding capital markets or other financial information, is obtained from sources which we, and our suppliers believe reliable, but we do not warrant or guarantee the timeliness or accuracy of this information. Neither our information providers nor we shall be liable for any errors or inaccuracies, regardless of cause, or the lack of timeliness of, or for any delay or interruption in, the transmission thereof to the user. With respect to information regarding financial performance, nothing on this website should be interpreted as a statement or implication that past results are an indication of future performance.