
Let's begin with a simple premise: The market bottom of December of 2018 was a hurried, violent correction within a grand secular bull market that served as the first real reset of this secular bull since its inception.
When Zenolytics was one of the only venues of market intelligence pounding the table on technology stocks late in 2018 in a note titled "How Everything That Happened In 2018 Now Makes Technology Names A Screaming Buy," it was with a correlation to the last time a real reset took place within a secular bull market that was both hurried and violent: 1998.
Here is an excerpt from the piece on December 31st, 2018:
"The buying opportunity here for technology, in particular, is one of the best over the past decade. Whether this assessment of risk/reward ends up being something that lasts one quarter or the entirety of 2019, I am not sure yet."
The correlation to 1998 was even stronger than originally expected, as we are now tracking the market of 1998/1999 almost exactly. Here is an illustration of the Nasdaq Composite from 1998-1999 compared to the Nasdaq since the December lows to present.
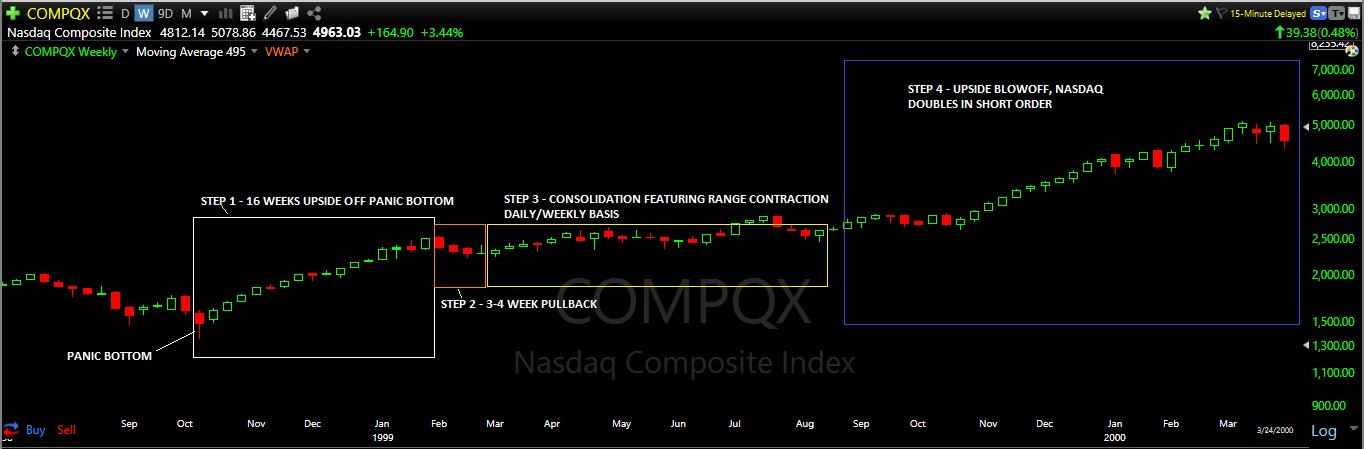
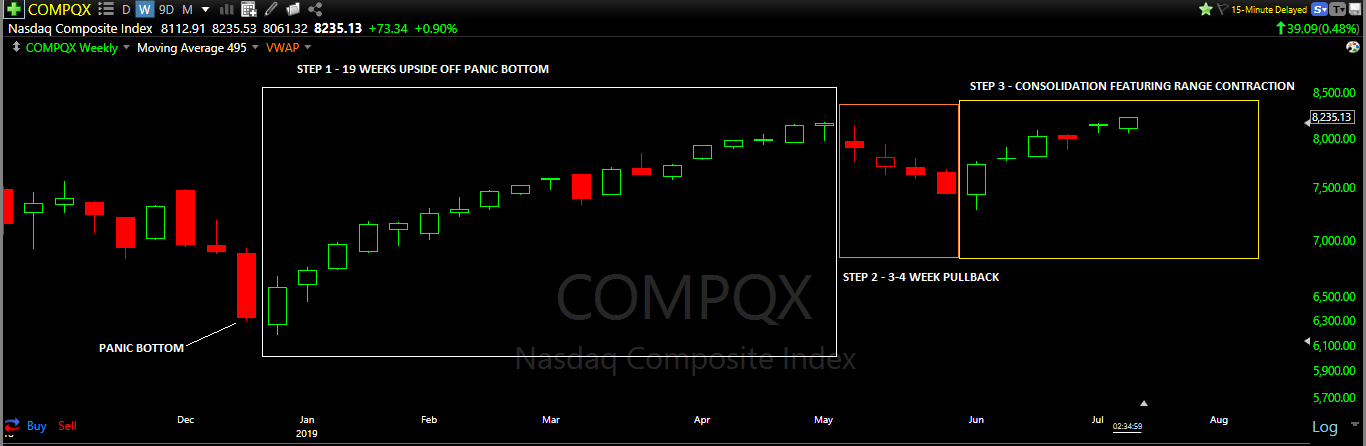
The price structure between the two timeframes is uncanny, from the persistent manner of the STEP 1 rally in both graphics to the short-term nature of the first correction in STEP 2, all the way to manner in which both markets consolidated following the first correction moving from STEP 2 to STEP 3. STEP 4 we don't see in the chart of the current market, but we have an idea of what to expect.
There is an important caveat to consider that will change this correlation for the present market. In the market of 1998/1999, the panic low that set this grand sequence in motion was made in October. The low for the current market was basically made as the calendar flipped from 2018 to 2019. This is important because it will shorten the length of the consolidation period for the the current market by 3 months due to the natural forces that take over towards the end of Q3, into Q4.
In other words, the seemingly long consolidation period you are seeing in 1999 won't take place in the current market because of the late-December low. The markets will have a 1999 type of reaction on the upside starting in September and lasting through the end of 2019.
By all indications, the upside potential into year end, while perhaps not being as mind-numbing at the market of 1999. will still be substantial.
Strap on your mud boots, there's still a lot of sewer salmon in these rivers.
Zenolytics now offers Turning Points and ETF Pro premium service Click here for details.
Disclaimer
This website is for informational purposes only and does not constitute a complete description of our investment advisory services. No information contained on this website constitutes investment advice.
This website should not be considered a solicitation, offer or recommendation for the purchase or sale of any securities or other financial products and services discussed herein. Viewers of this website will not be considered clients of T11 Capital Management LLC just by virtue of access to this website.
T11 Capital Management LLC only conducts business in jurisdictions where licensed, registered, or where an applicable registration exemption or exclusion exists. Information contained herein is not intended for persons in any jurisdiction where such distribution or use would be contrary to the laws or regulations of that jurisdiction, or which would subject T11 Capital Management LLC to any unintended registration requirements. Visitors to this site should not construe any discussion or information contained herein as personalized advice from T11 Capital Management LLC. Visitors should discuss the personal applicability of the specific products, services, strategies, or issues posted herein with a professional advisor of his or her choosing.
Information throughout this site, whether stock quotes, charts, articles, or any other statement or statements regarding capital markets or other financial information, is obtained from sources which we, and our suppliers believe reliable, but we do not warrant or guarantee the timeliness or accuracy of this information. Neither our information providers nor we shall be liable for any errors or inaccuracies, regardless of cause, or the lack of timeliness of, or for any delay or interruption in, the transmission thereof to the user. With respect to information regarding financial performance, nothing on this website should be interpreted as a statement or implication that past results are an indication of future performance.